
General rules:
Exceptions may be made at the discretion of the mods.
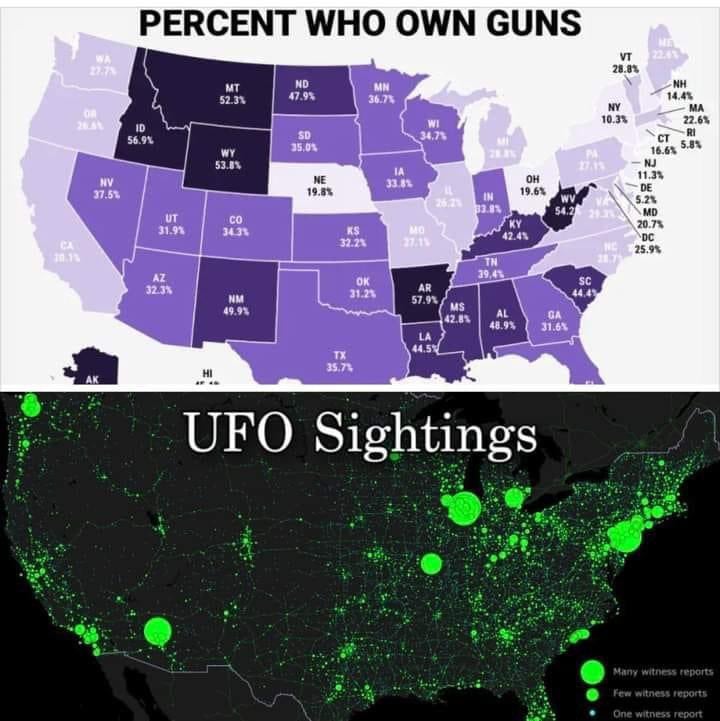
Top: map of where people don't live
Bottom: map of where people live
Getting shot by a redneck or getting probed by Elvis, take your pick.
I bet that second map would look dramatically different if it was sightings per capita.
Also how many are repeat callers.
"Hey Bert, Old Man Jenkins called in another Santa Clause, do you have eyes on a plane around the airport?"
"Sure do, Tina. Small single engine is making it's approach now."
"okay thanks. I'll give you another ring when he calls in for the 243rd time this year..."
Back when I was a teenager in church, some of the local cops would be talking shit about the "crazies" they would arrest, and apparently one guy would call in about UFOs every time the nearest air force base used the training airspace that was overhead. Multiple times a week, and I guess never listened that it wasn't aliens.
these aliens sure are advanced, they even replicate our technology to blend in!
The top is the percentage of people while the bottom is the total incidence. This is an apples and oranges comparison. In this case the bottom map is functionally a population map as others have pointed out. Most stats are best in "#/thousand people" or equivalent, but should always in the same unit if compared.
Where is this top map from? I can't say for the rest of the states, but oregon and Washington are way off. WA has 34% gun ownership and OR has 44%
Source: https://www.rand.org/research/gun-policy/gun-ownership.html
It might be per household vs. people with a firearm registered to them personally? (Note i have no idea how firearm registration works in thr US but it's the first explanation that comes to mind since your source is specifically "adults living in a household with at least one firearm")
Where is the correlation? South Carolina? Some in Arizona? Is the point that there’s more UFO sightings in places with low gun ownership? Please explain.
Yeah, the joke is that aliens might be scared of the gun places.
(Reality is just that the % is higher in rural areas, and more people = more sightings)