428
That’ll be Why the Median is Barely Over 40
(lemmy.world)
That can't be right though... 1000 people isn't nearly enough to drag the average income down 5k BELOW the median income in a nation of over 300 million. It should still be higher due to the long tail on the high side of incomes.
Proof: Average income in top 1% is 819k https://www.unbiased.com/discover/banking/how-much-income-puts-you-in-the-top-1-5-or-10#:~:text=To%20be%20in%20the%20top%201%25%20of%20earners%2C%20you',earn%20an%20average%20of%20%243%2C312%2C693.
Solve the weighted average:
819 * 0.01 + x*0.99 = 74.5
Where x is the remaining average. X≈66.3k, and that's excluding the ENTIRE 1% which is over a MILLION people at least, depending on how you count it. America is big.
I guess the lesson here is don't trust unsourced factual claims in political memes because they are probably just made up
You mean information on an obvious anti-US propaganda community might not be particularly high quality?
86% of statistics quoted on the internet are made up.
Yep. And never trust information embedded in a jpeg if it doesn't include a source!
Yeah, these numbers don't make sense.
To explain the first panel alone, by removing the top ten earners from the data set, you'd move the median to.the lower end by 5 "slots". I'm confident that there are more than 100 people in the USA who make between $65k and $75k (I know at least 25).
If they mean the average/mean, that still doesn't add up. Assuming that the US population is about 350 million and that 350,000,000 - 10 ~= 350 million.
NGL, formatting the equations and walking then out step by step is a pain, esp on mobile, but the answer I came to is by multiplying the difference in mean values (~$10,000) by the US Population (350 million), which yields $300,000,000,000 or about 10 billion per person once evenly distributed.
Elon Musk (2nd richest man in the world at time of writing) has a net worth of less than $5 billion rn, but the numbers here imply that the top earners in the US made at least 60x that amount.
TL;DR: I'mma need some sources on this.
Edit: on my app (Voyager/Wefwef) I can't save draft comments to go look at the meme while commenting, so definitely have some things off from.what the meme was saying, but they're close enough I'm leaving as it.
Also, spelling/grammar
Your slot argument only makes sense for median, when the picture is about means. I still think it's off though.
Yeah, I thought that seemed a little far fetched
But I think this is only about wages right? It doesn’t take into account growth in net worth based on shares, does it?
This is also why the publiclly discussed focus is on household income, which is mostly two incomes. Prior to the 80s single income housholds were the majority.
Maybe more than 2 when you add in the children!
I always assumed in the US "household income" went off tax filings, so it would only be individuals, or married filing jointly
Household
Definition
A household includes all the people who occupy a housing unit (such as a house or apartment) as their usual place of residence.
A household includes the related family members and all the unrelated people, if any, such as lodgers, foster children, wards, or employees who share the housing unit. A person living alone in a housing unit, or a group of unrelated people sharing a housing unit such as partners or roomers, is also counted as a household. The count of households excludes group quarters. There are two major categories of households, "family" and "nonfamily."
Household is a standard item in Census Bureau population tables. source
It’s physical building or apartment people live in. 4 individual single tax filing roommates count as a household.
Remember kids, always account for outliers in your datasets and also eat the rich.
Or don't. Worst kind of food poisoning. Bioreactors are safer.
Is this fact/accurate??
Excluding top 1000 drops the average in half??
Definitely a reason to only ever use median instead.
Median is the middle point of the population and has its place when the range doesn't skew too much. I think a good representation of income is by percentages, as in "90% of people make $x,000 or below". This chart had dated (2010) data but its a better representation than I've found elsewhere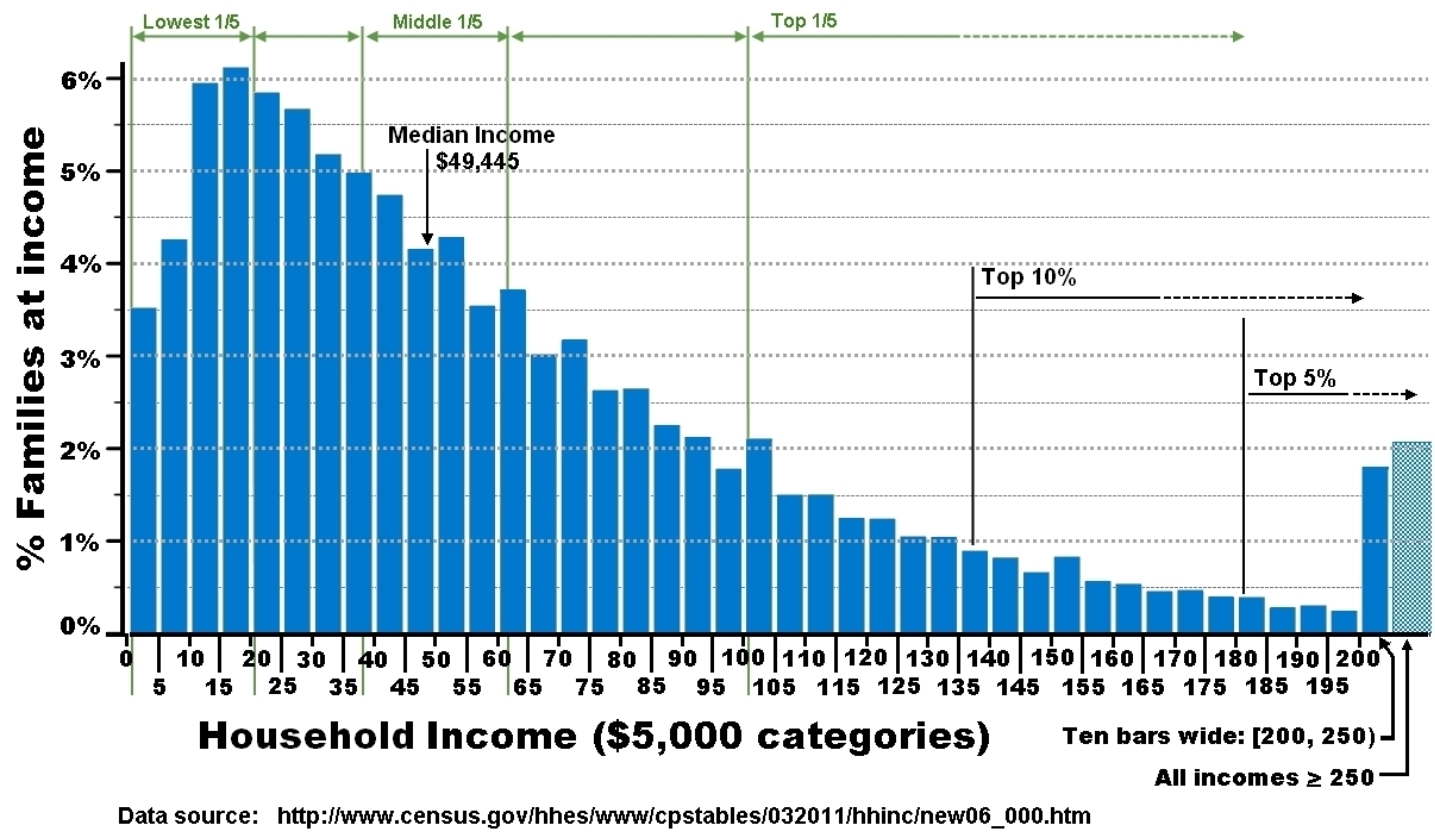
Nah there's no way this is accurate.
Makes sense 36,000. 8K goes to taxes. End up with 28,000 for my entire life for a year. And I work very hard
5k if you're single. 3.5k if you're married. In PA at least. Not sure where you live but your numbers seem extreme.
For the second frame of this to be true, assuming 157 million working Americans, each of the top 10 earners would be making over $150 billion a year on average. This amount is close to the net worth of the world's richest people, and couldn't possibly be their annual income.
edit: fixed error
What? The world's richest people are not in the 1,5 billion dollars range. They are in the 200-100 billion dollars. And it would be surprising if they didn't earn 150 million just from owning this amount of wealth each year.
The rich are consolidating the market and republicans are too busy incorrectly blaming Joe Biden who is trying to support labor by implementing safety measures and holding businesses accountable.
I see lots of people are pointing out that these numbers don't make sense. Here are some of my thoughts.
I'm not an economist so I'm probably making some very basic mistakes but...
GDP per capita is $76.3k [Google] Average household size 2.6. [Google] So GDP per household is $198.4k [Calculator]
That is the mean productivity per household.
But the median income per household is $75k [Google]
So what happens to the $123.4k of productivity (198.4k-75k) per household that isn't paid to workers? It's in the outliers and is asset appreciation isn't it?
very disinfectant mistakes
I'm staring at this trying to figure out if autocorrect did you wrong and if it did, what was it originally
PS: A very disinfectant mistake

Guys, stop trying to figure out the average. You guys should look for the mode (the most common income, not all income added and divided).
Edit: If anyone has the mode for american income, I'd love to hear it. I can't find it. Just the median and average.
the mode is probably 0.
e.g. there are plenty of people with exactly 0 income. there are few people with exactly another income.
Yup, Wikipedia says all exponential distributions have mode 0
It might work a bit better if incomes were bucketed into 5k brackets before taking the mode. From there, I guess you can take the mean or median of all the incomes that comprise the bucket?
It would still always be the lowest bracket, because most people make little and few people make much.
If you look at the horizontal lines here you get 50k brackets:
https://fourpillarfreedom.com/wp-content/uploads/2018/11/ind_inc0-1.jpg
The first bracket is ~65% of the population, the second bracket ~25%, the third bracket ~5%
Sauce?
https://www.statista.com/statistics/203183/percentage-distribution-of-household-income-in-the-us/
Keep in mind that household income really means 2 income sources, not average American income
Thats not the source of any of the stats in the meme though? There's no way the average income outside of the top 1000 is that low. Heck, that's not even a large proportion of "the 1%"
Which is why it’s vital to know the pitfalls of statistics.
Averages aren’t a baseline, and understanding the data’s intricacies is pivotal to good stats.
Anytime there’s generalizations, especially as they grow in size, you’re discounting the little guy, and the devil is in the details.
Hello, I am researching American crimes against humanity. . This space so far has been most strongly for memes, and that's fine.
There's other groups and you are welcome to add to them. USAuthoritarianism Linktree
See Also, my website. USAuthoritarianism.com be advised at time of writing it is basically just a donate link
Cool People: [email protected]

 Median individual income just over 40k in 2022