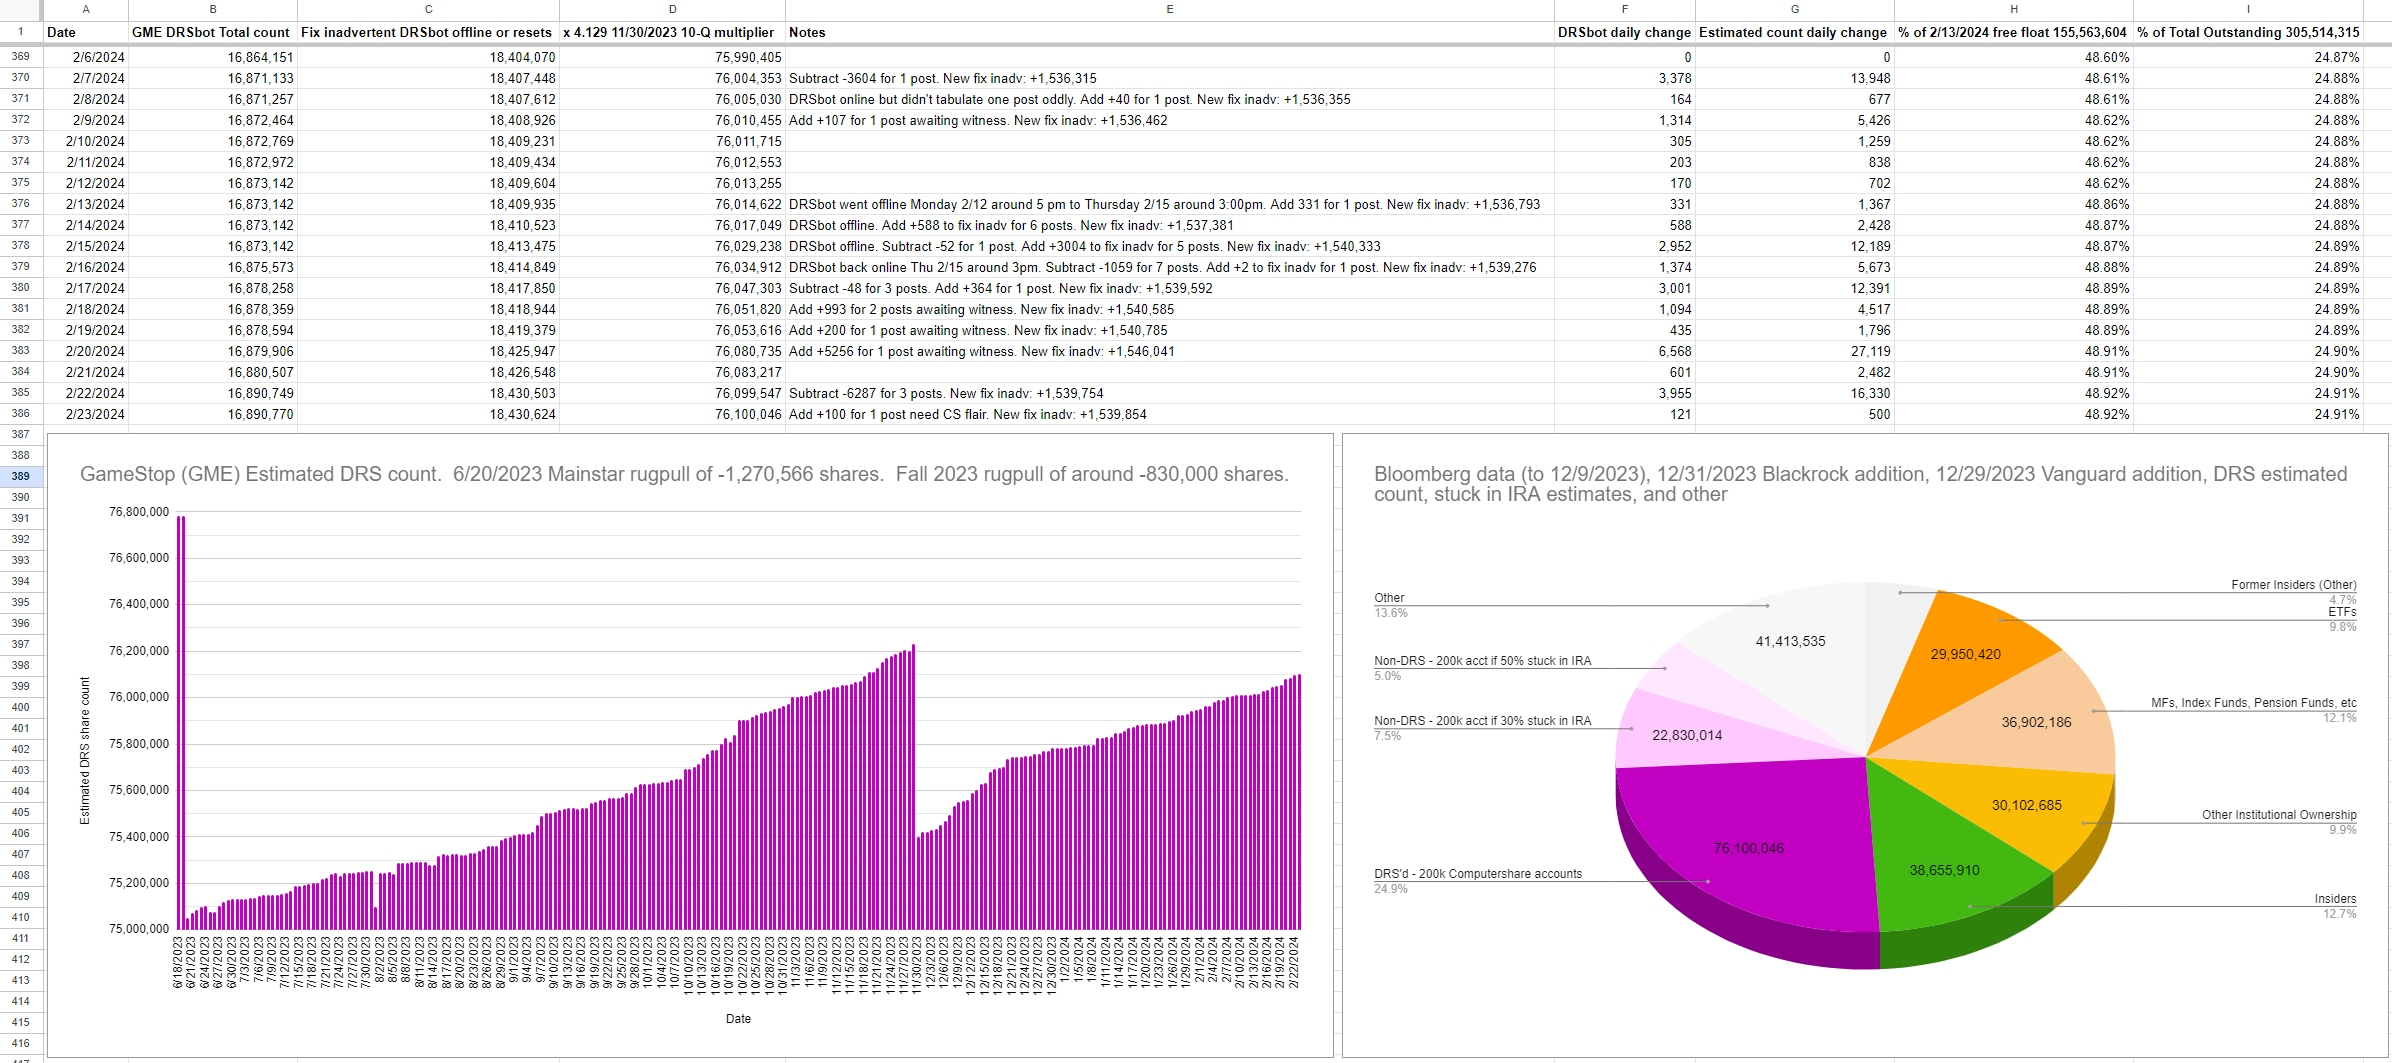
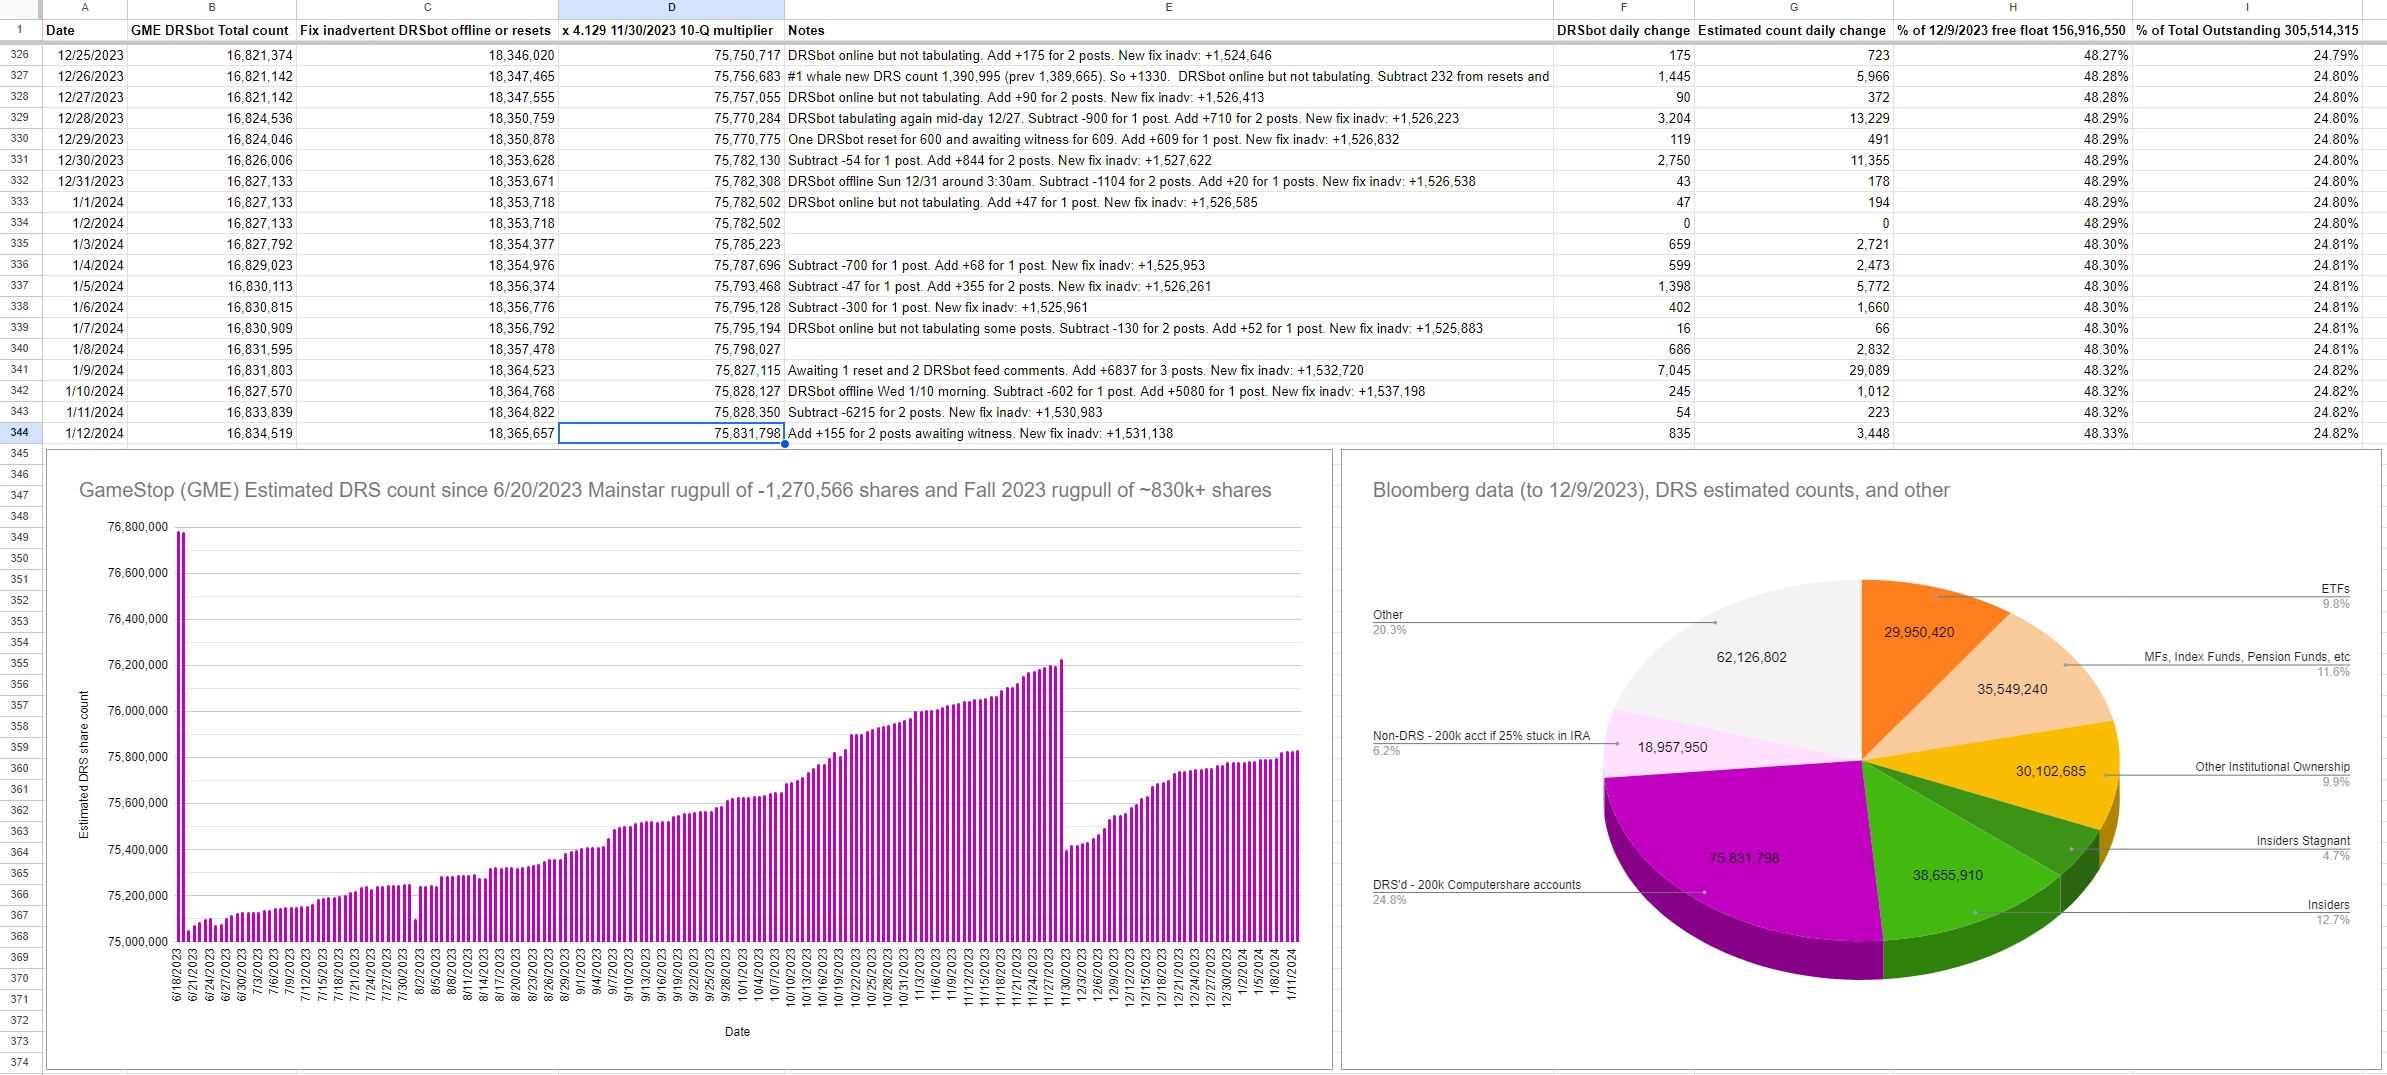
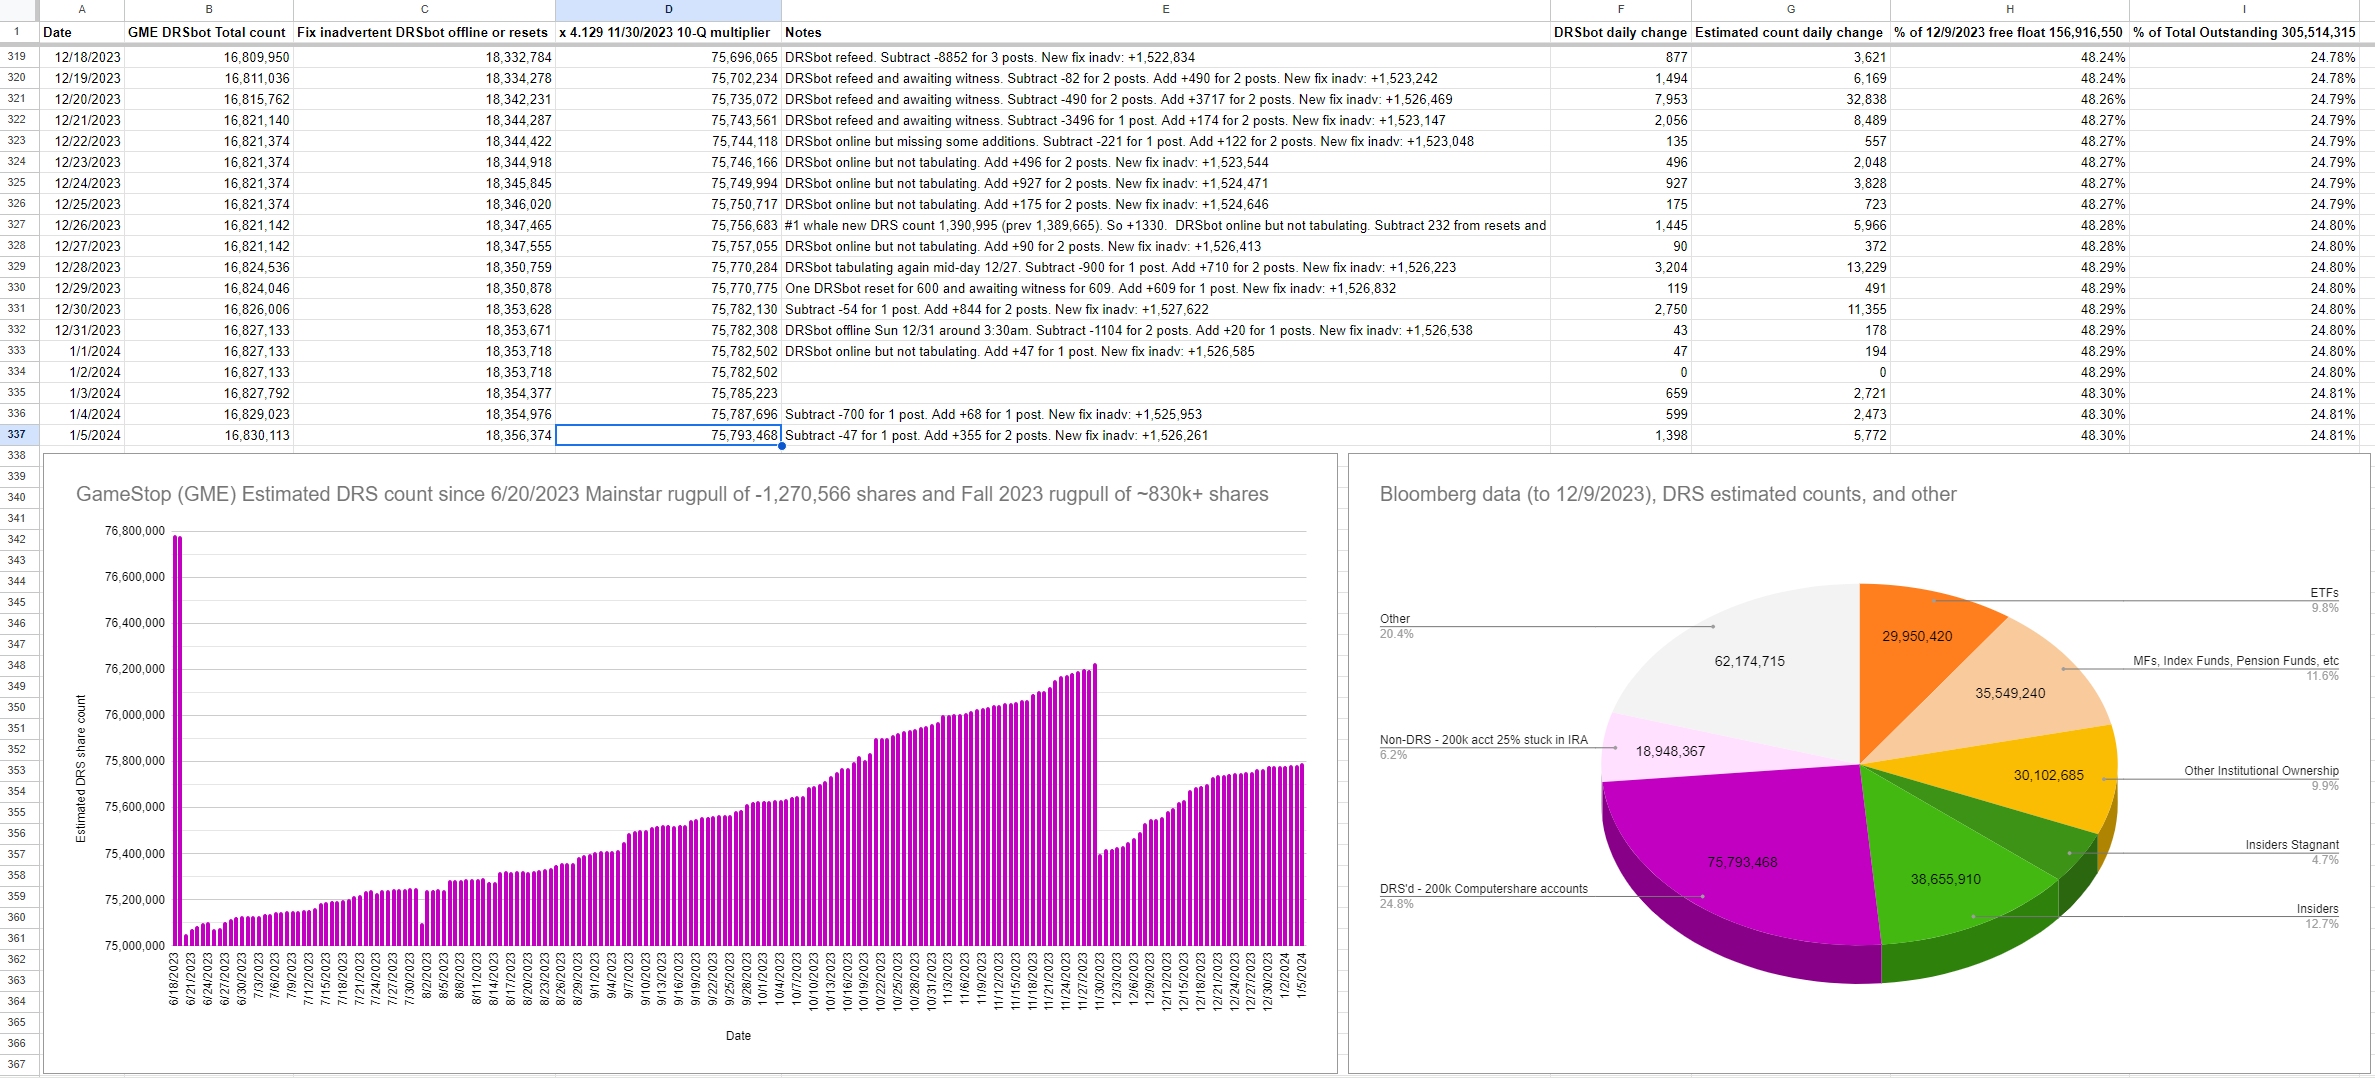
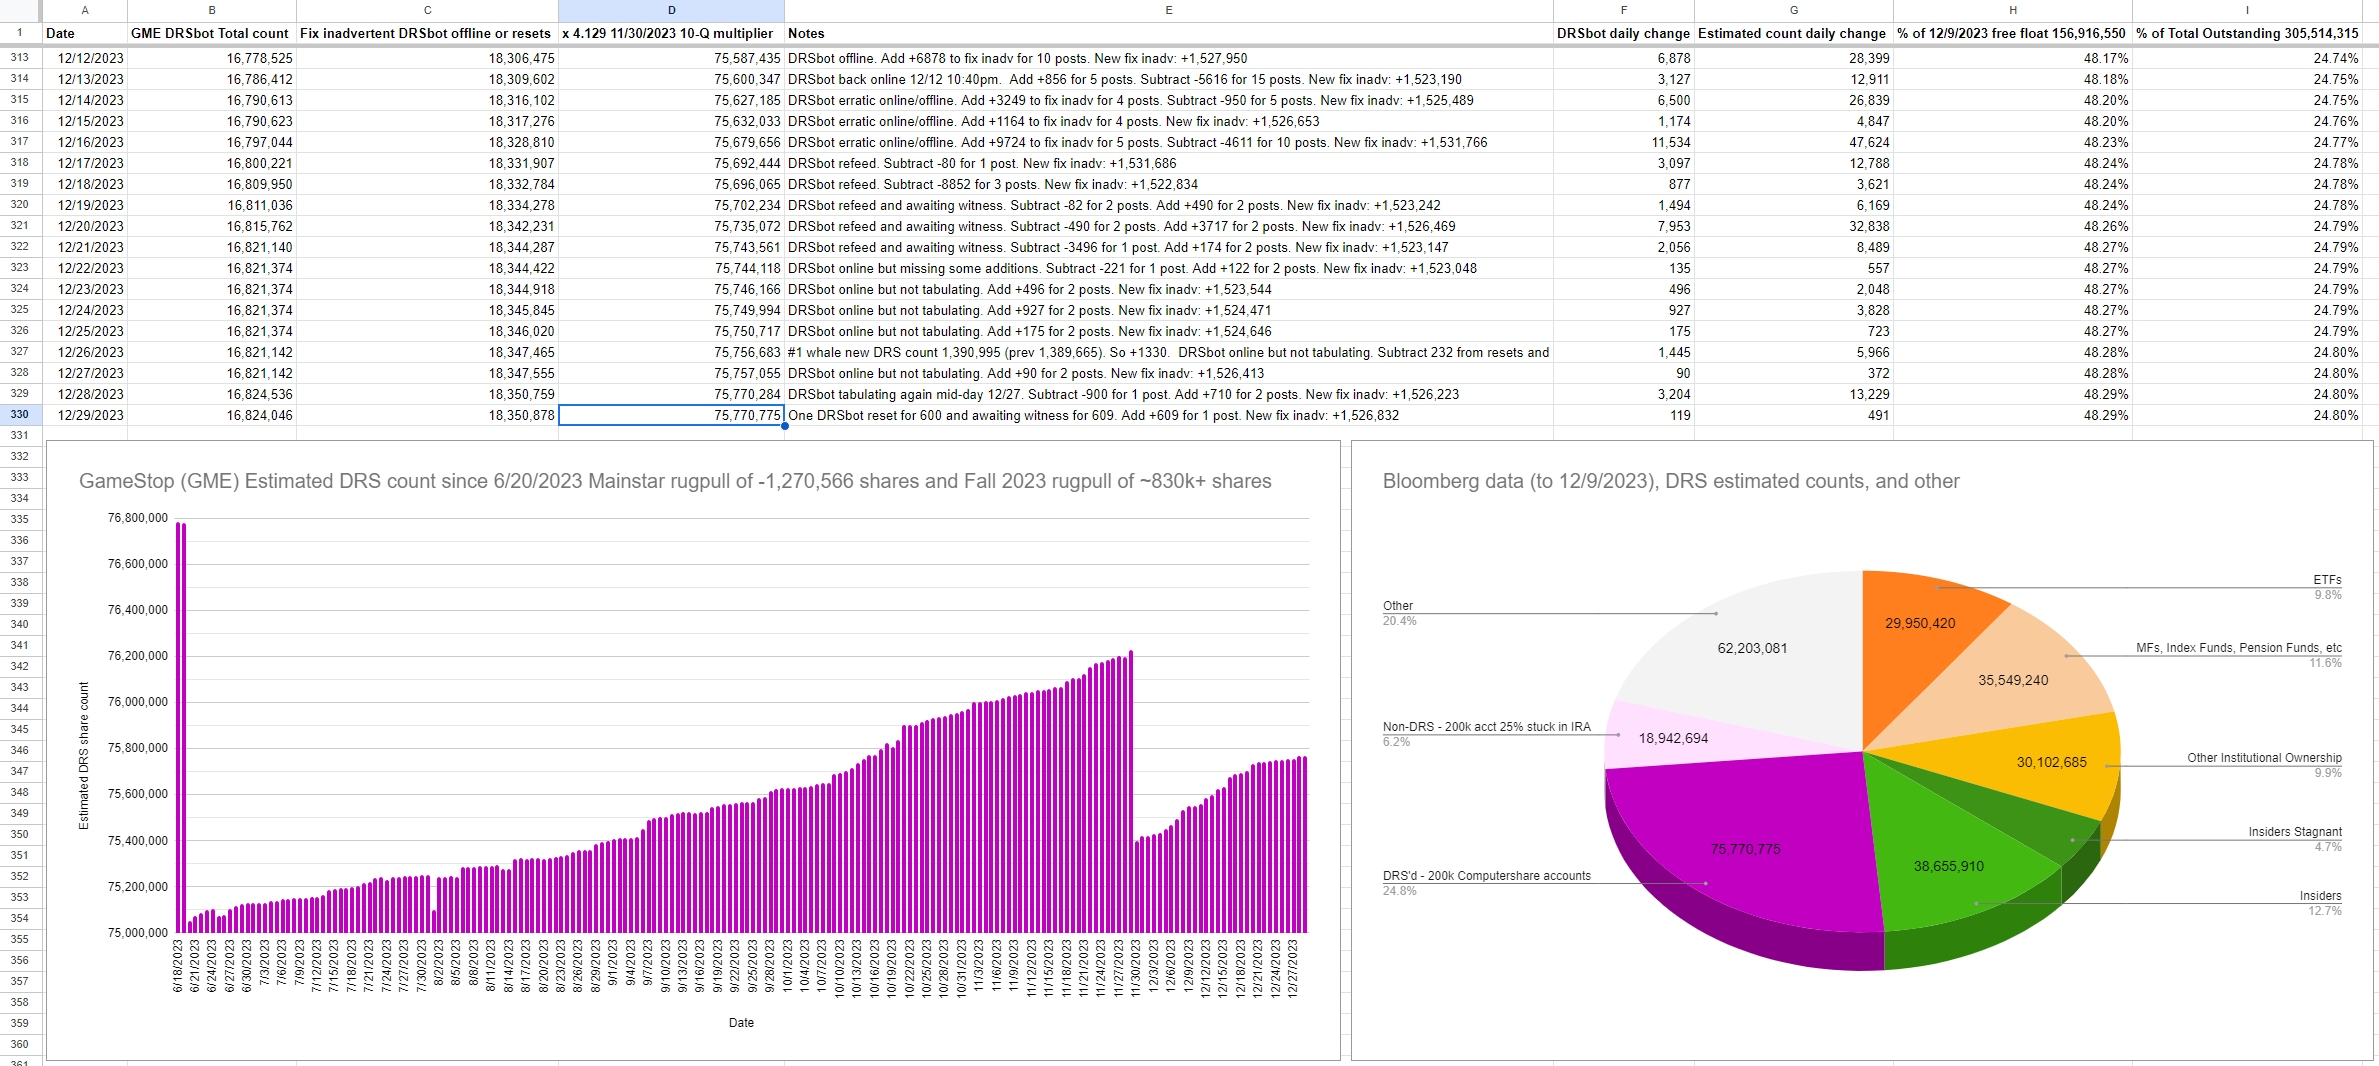
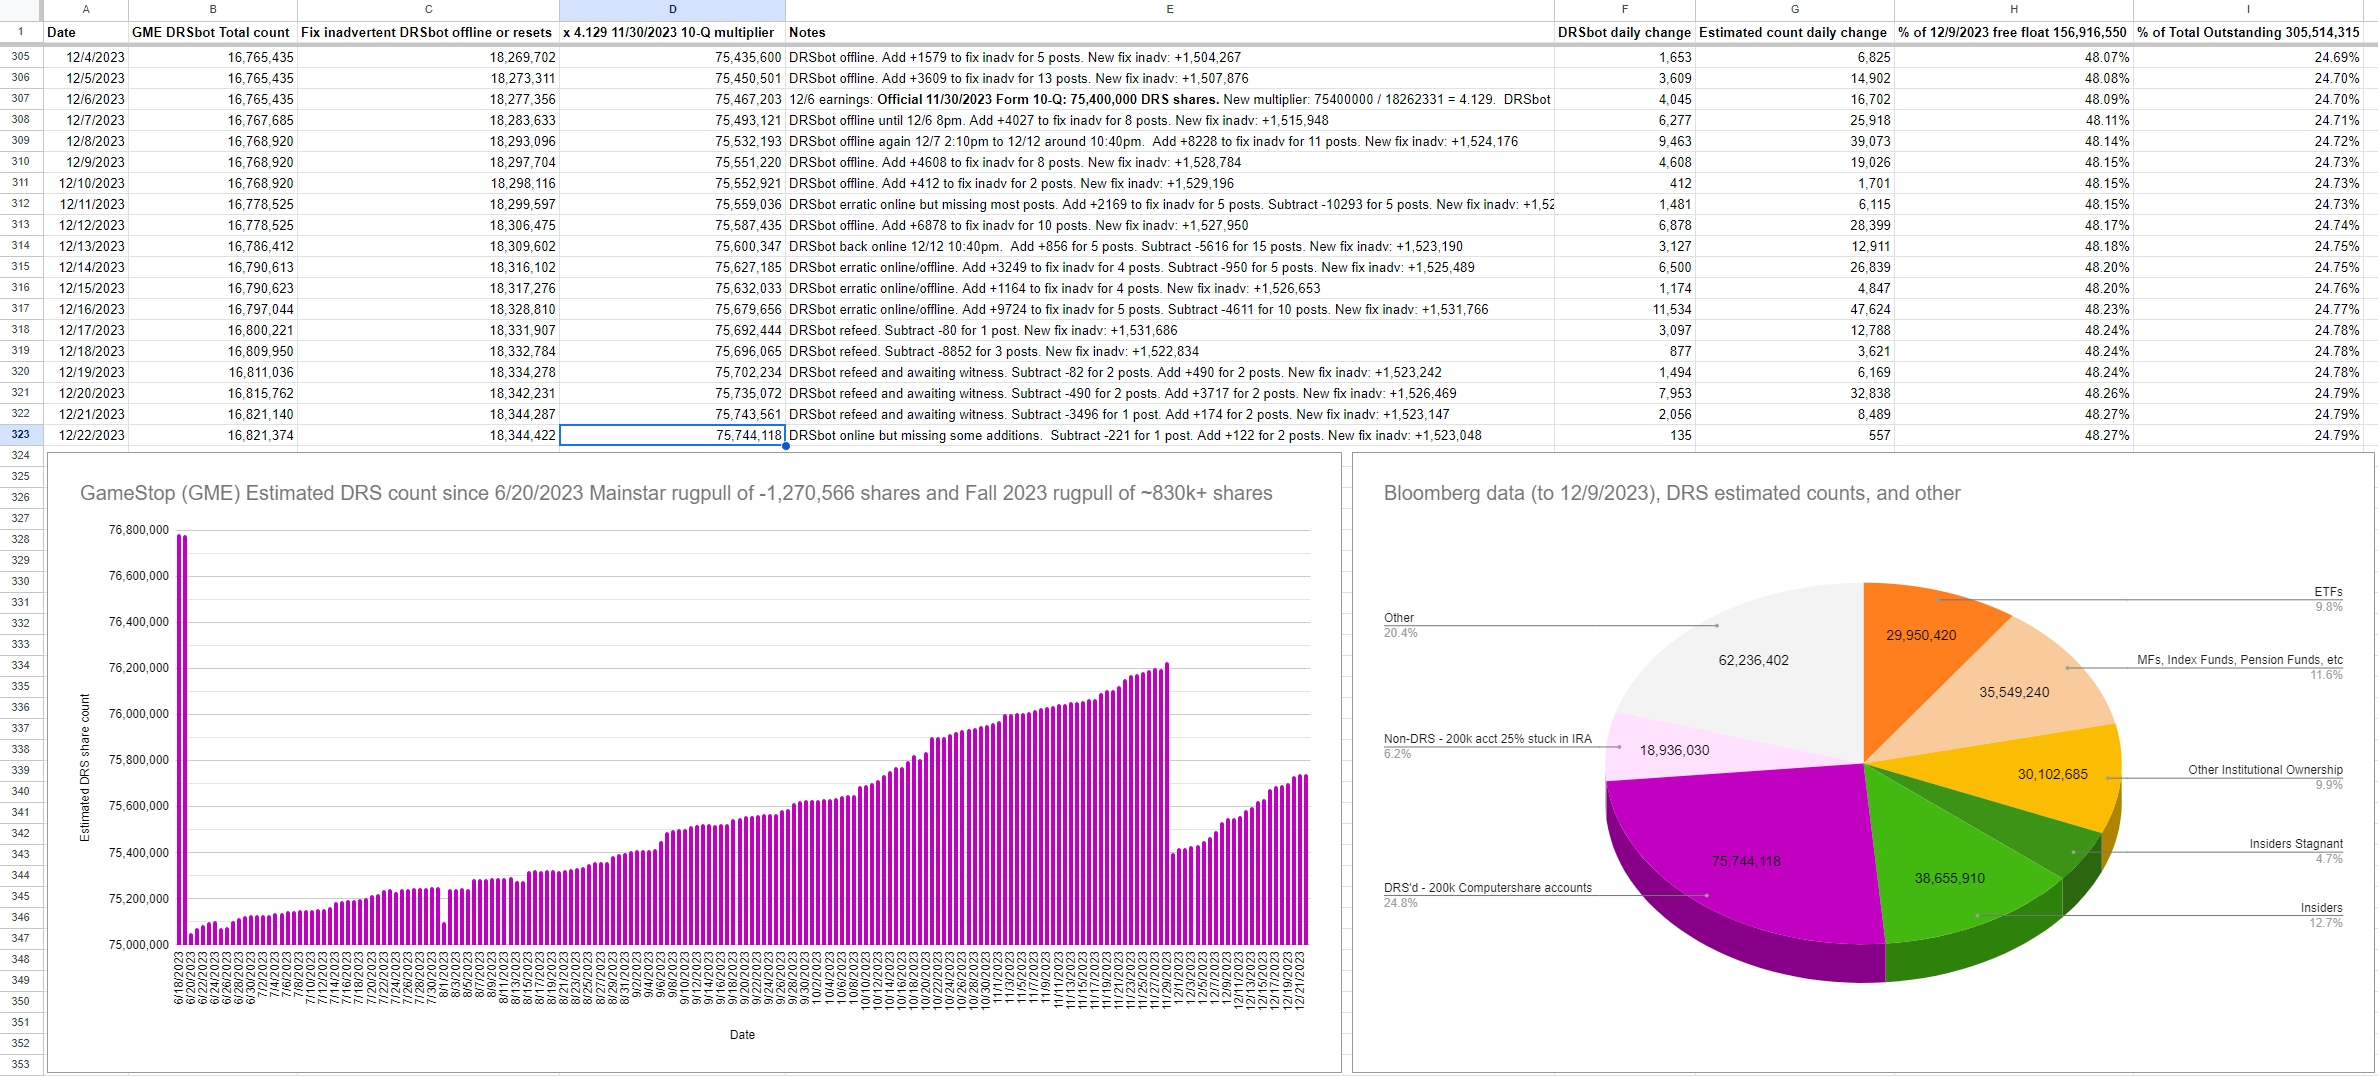
2/23/2024 Estimated DRS count: 76,100,046 ((using today's DRSbot total + fix inadvertent DRSbot offline or resets) x 4.129)
The 4.129 multiplier comes from 11/30/2023 Form 10-Q divided by DRSbot 11/30/2023 total: 75,400,000 / 18,262,331 = 4.129
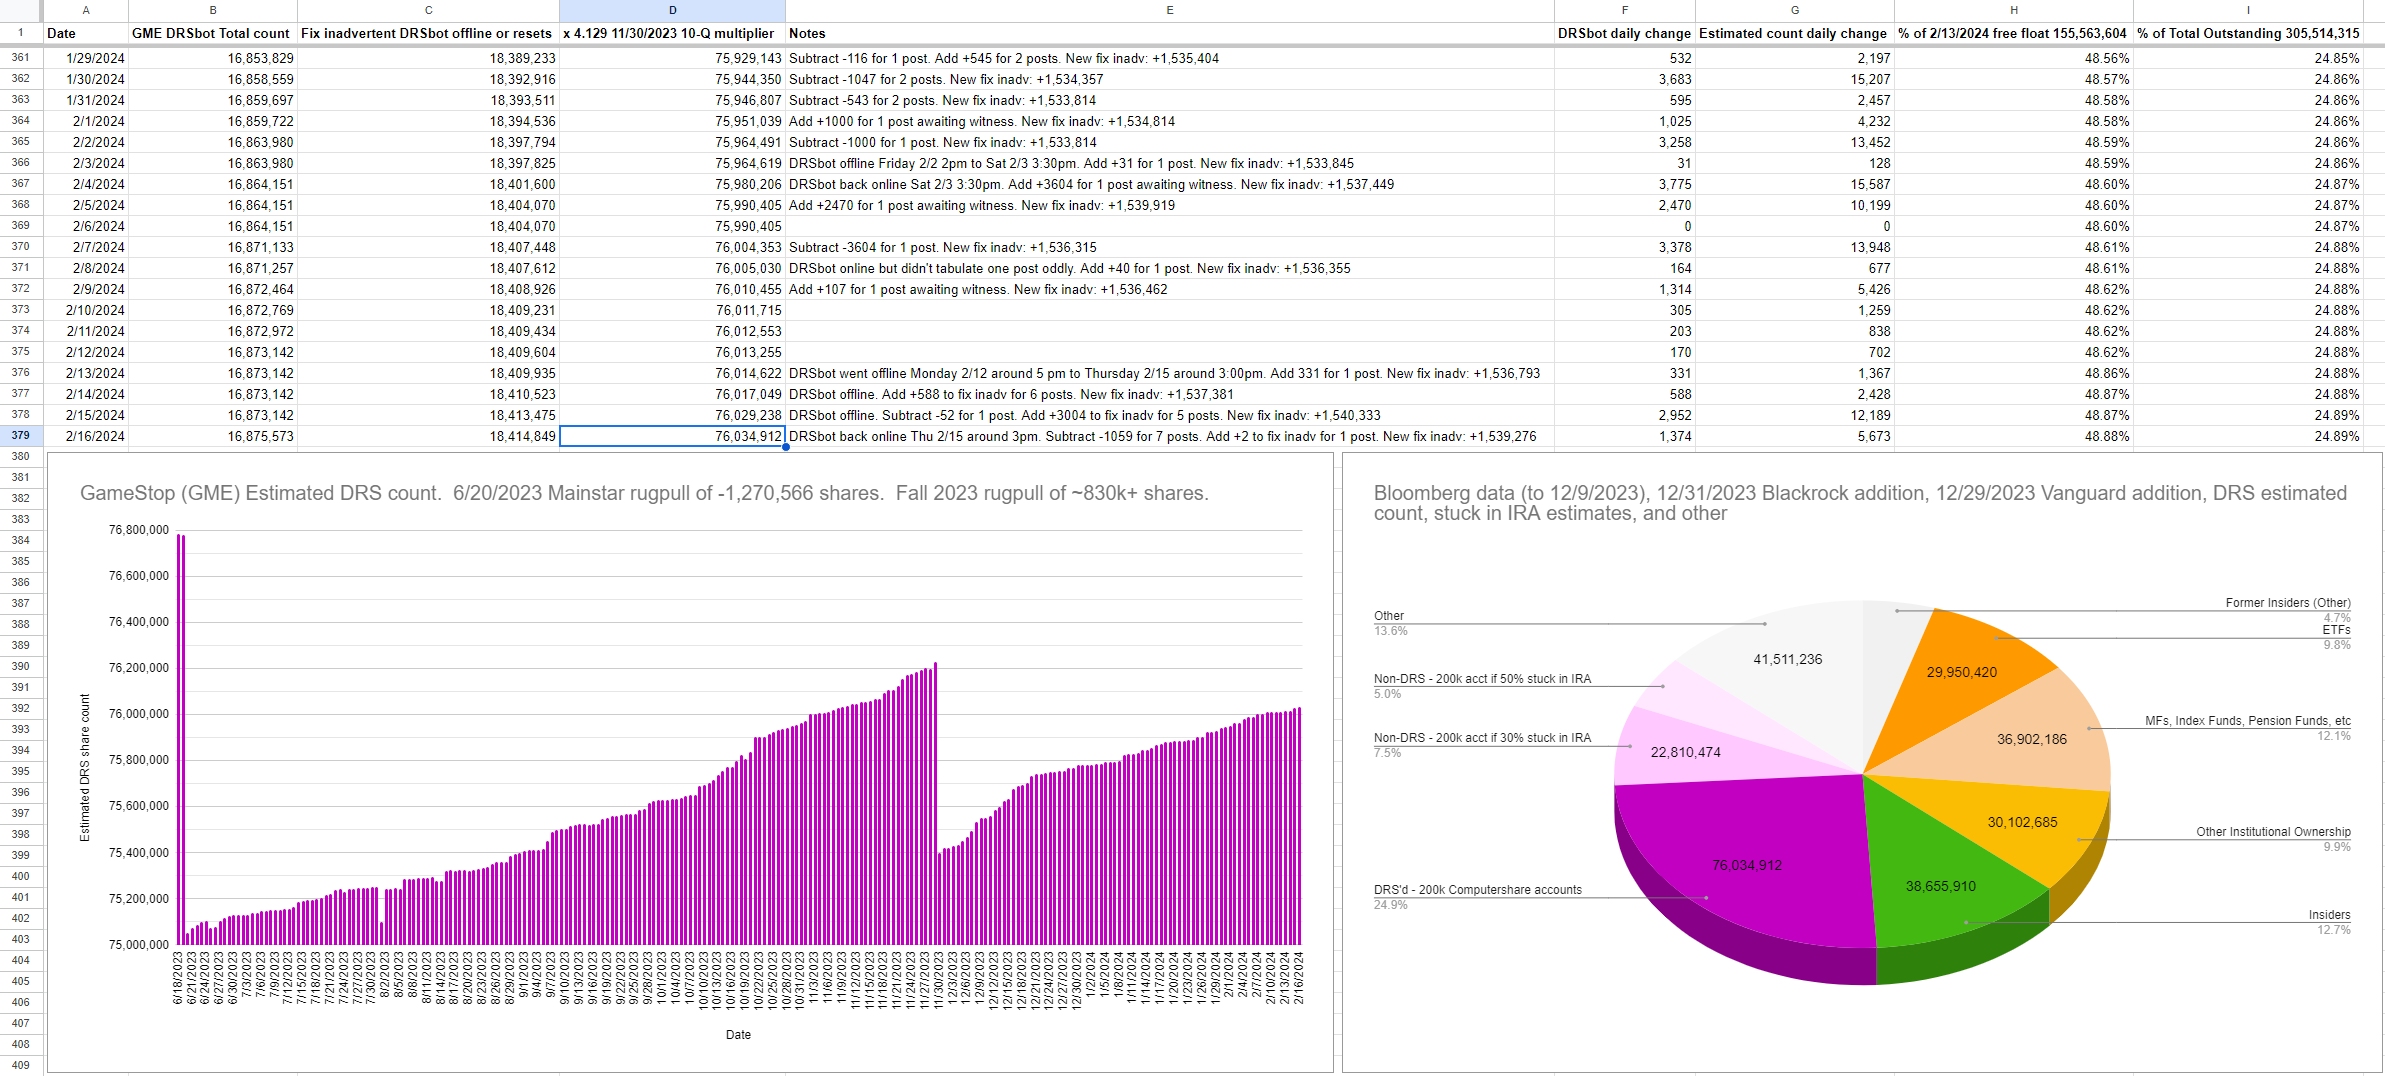
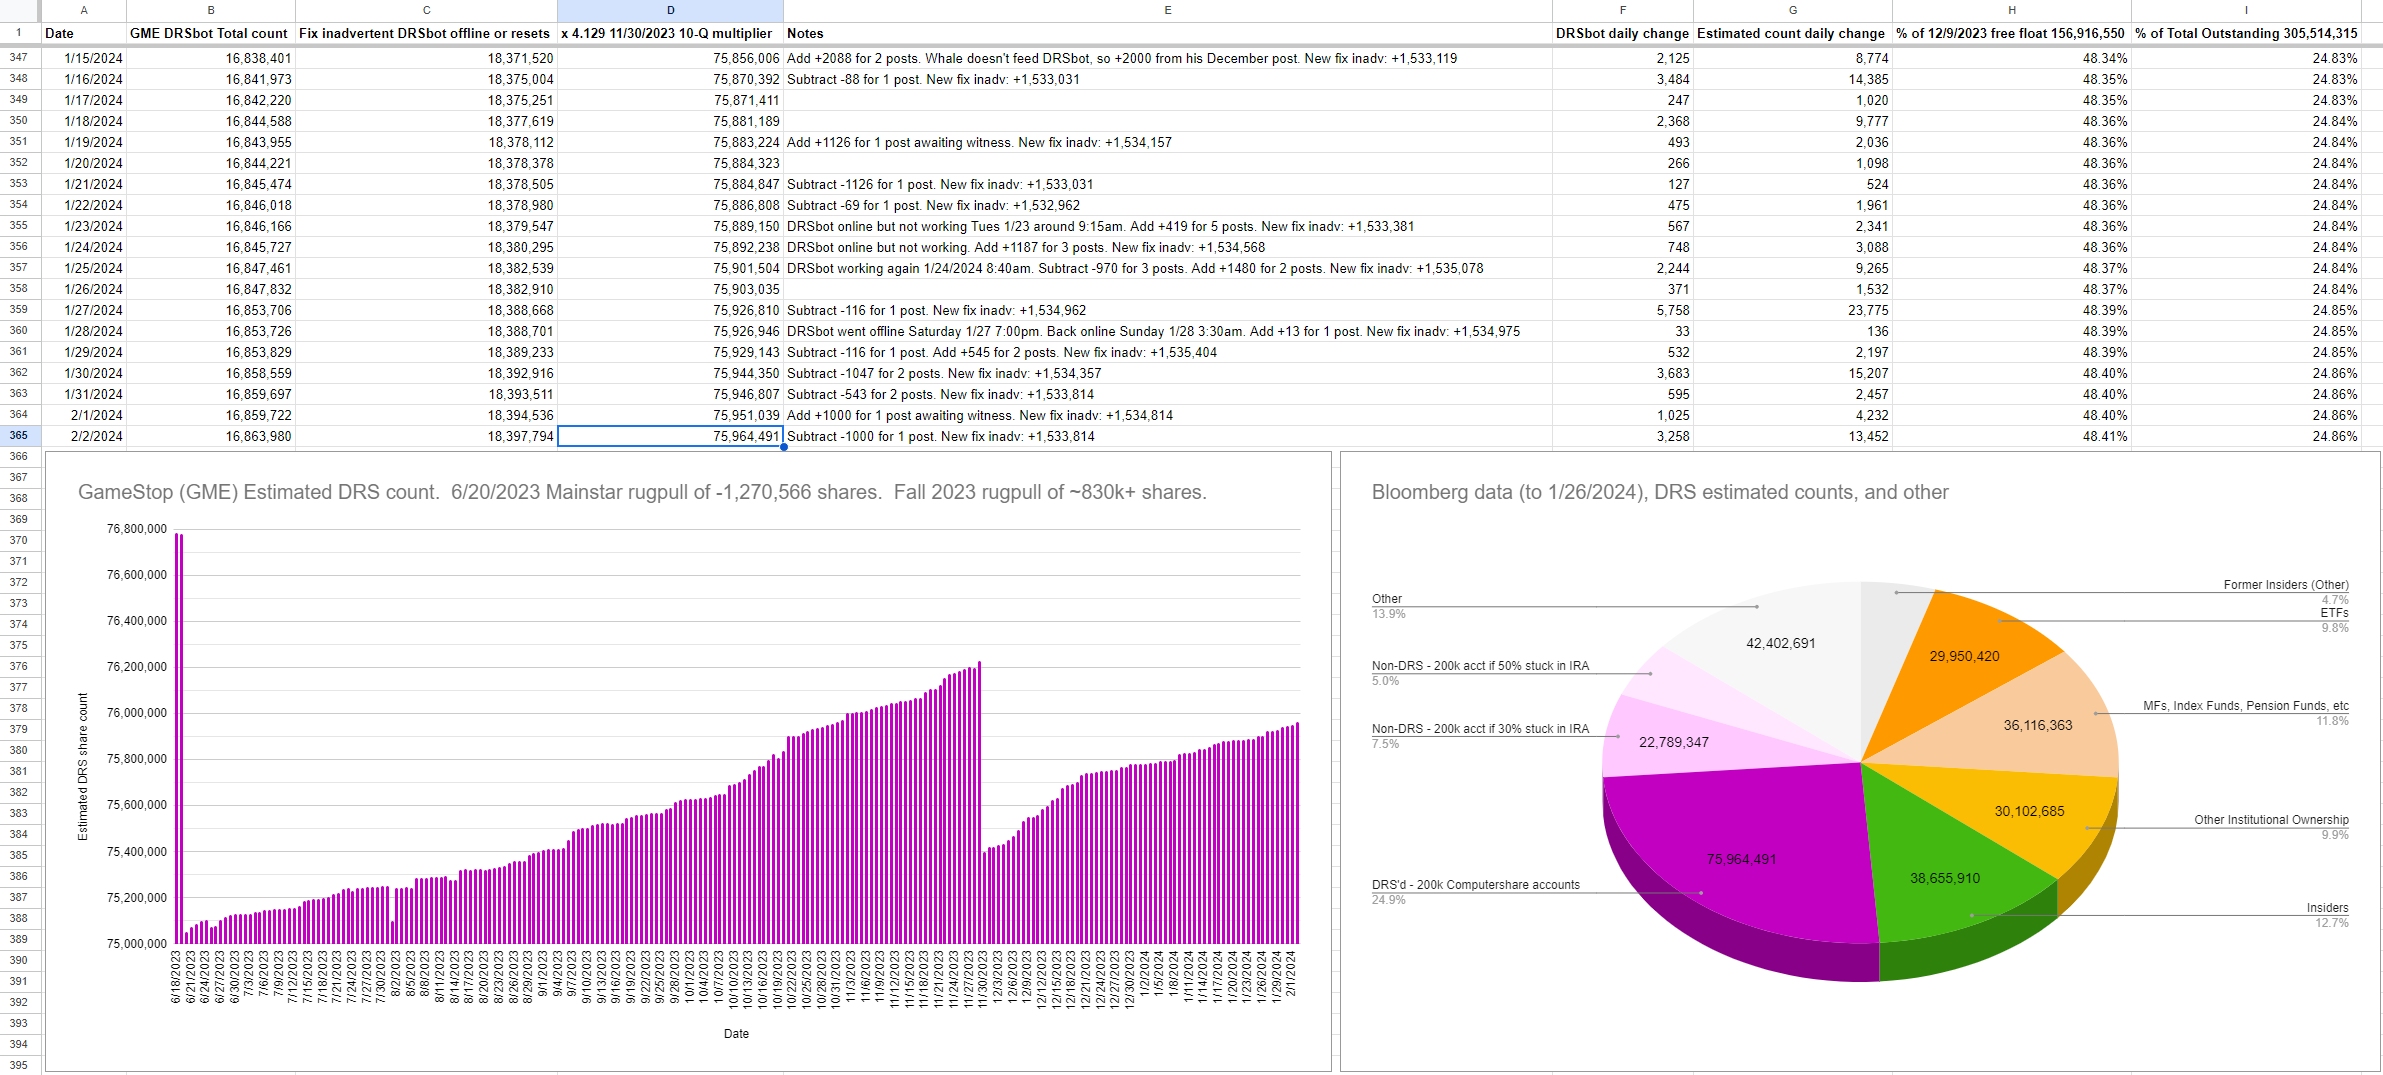
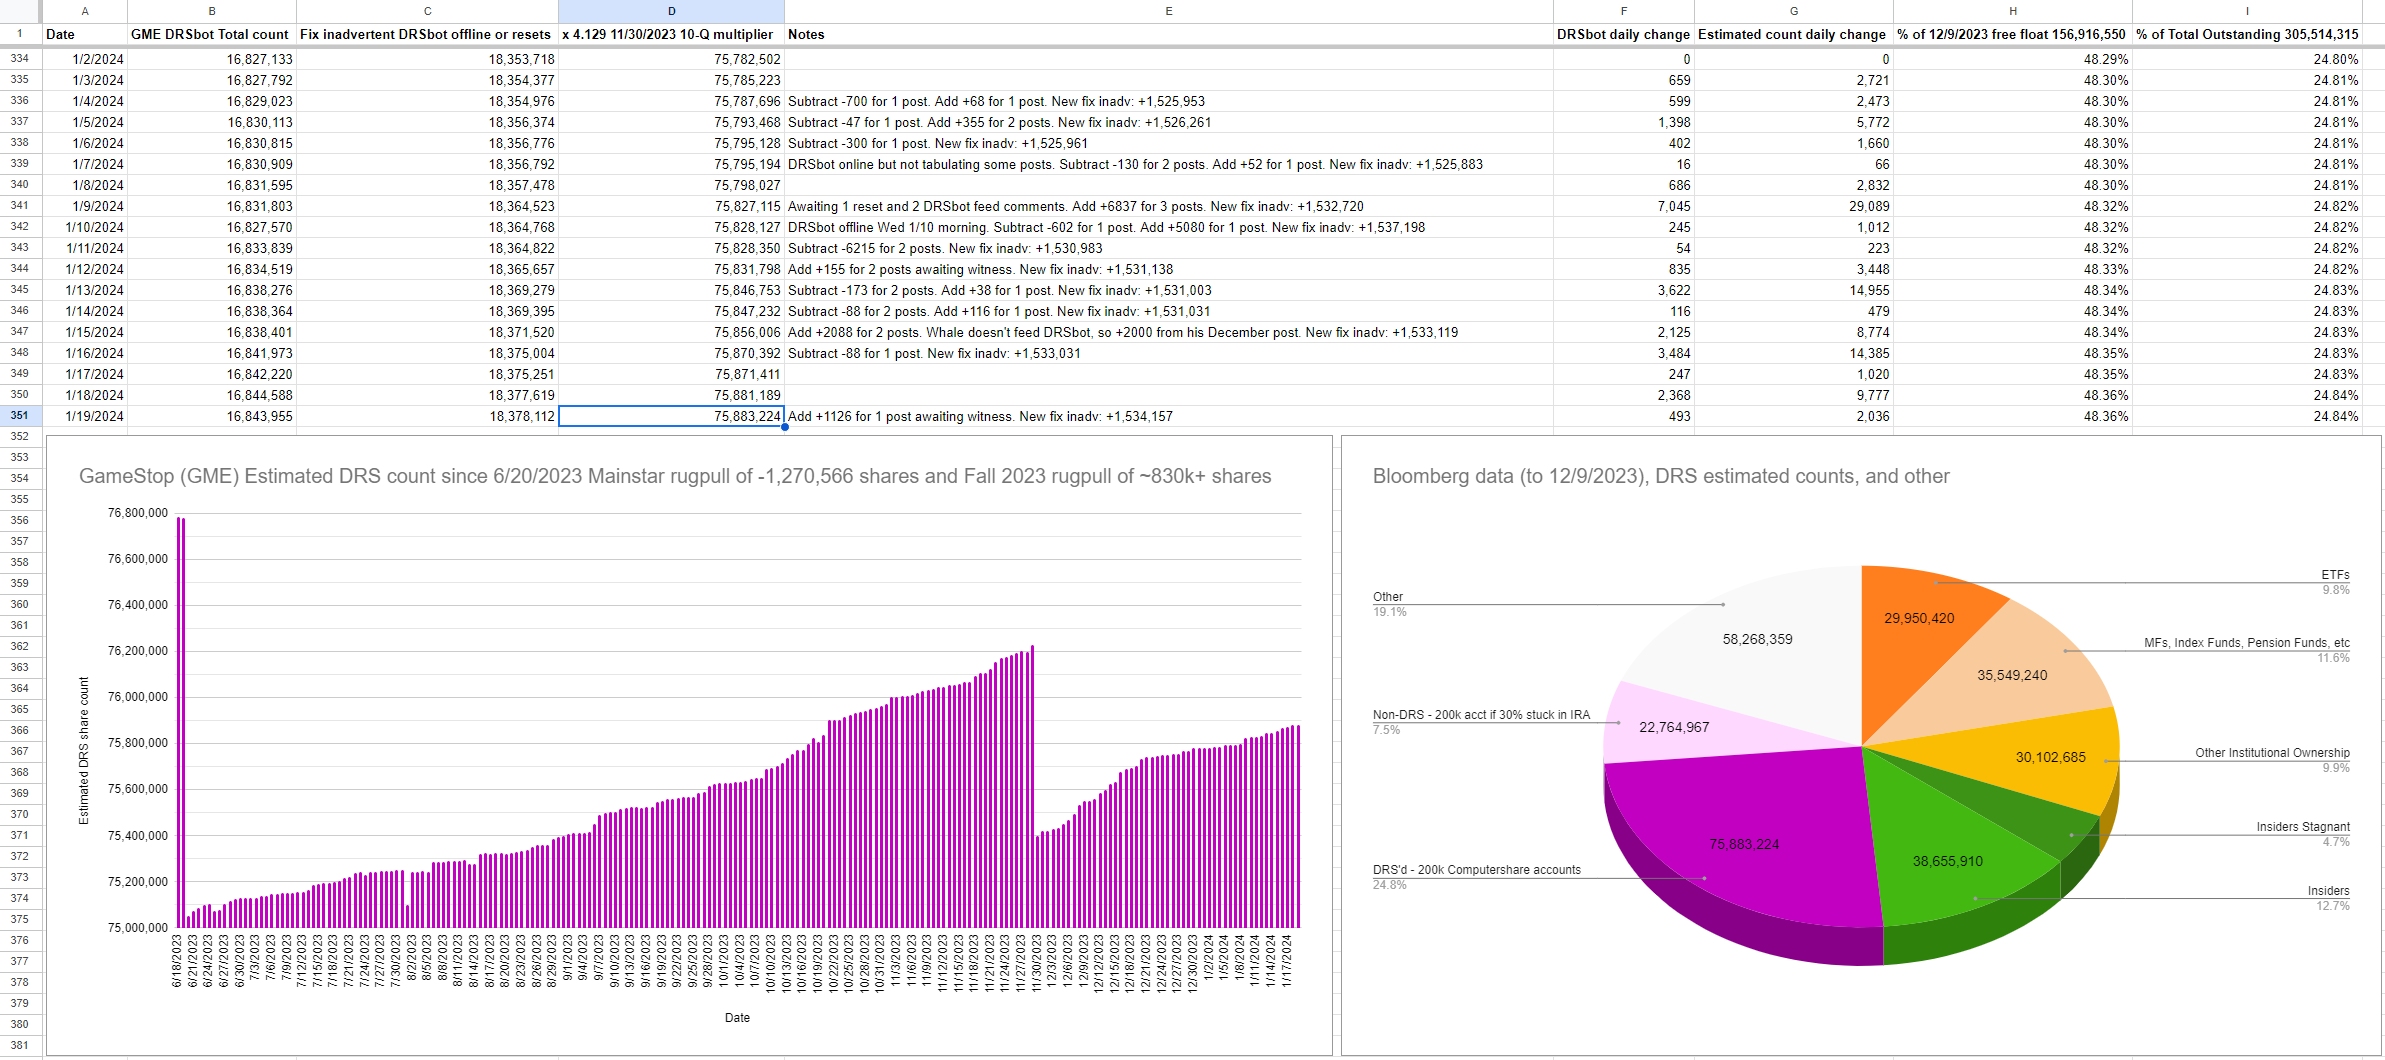
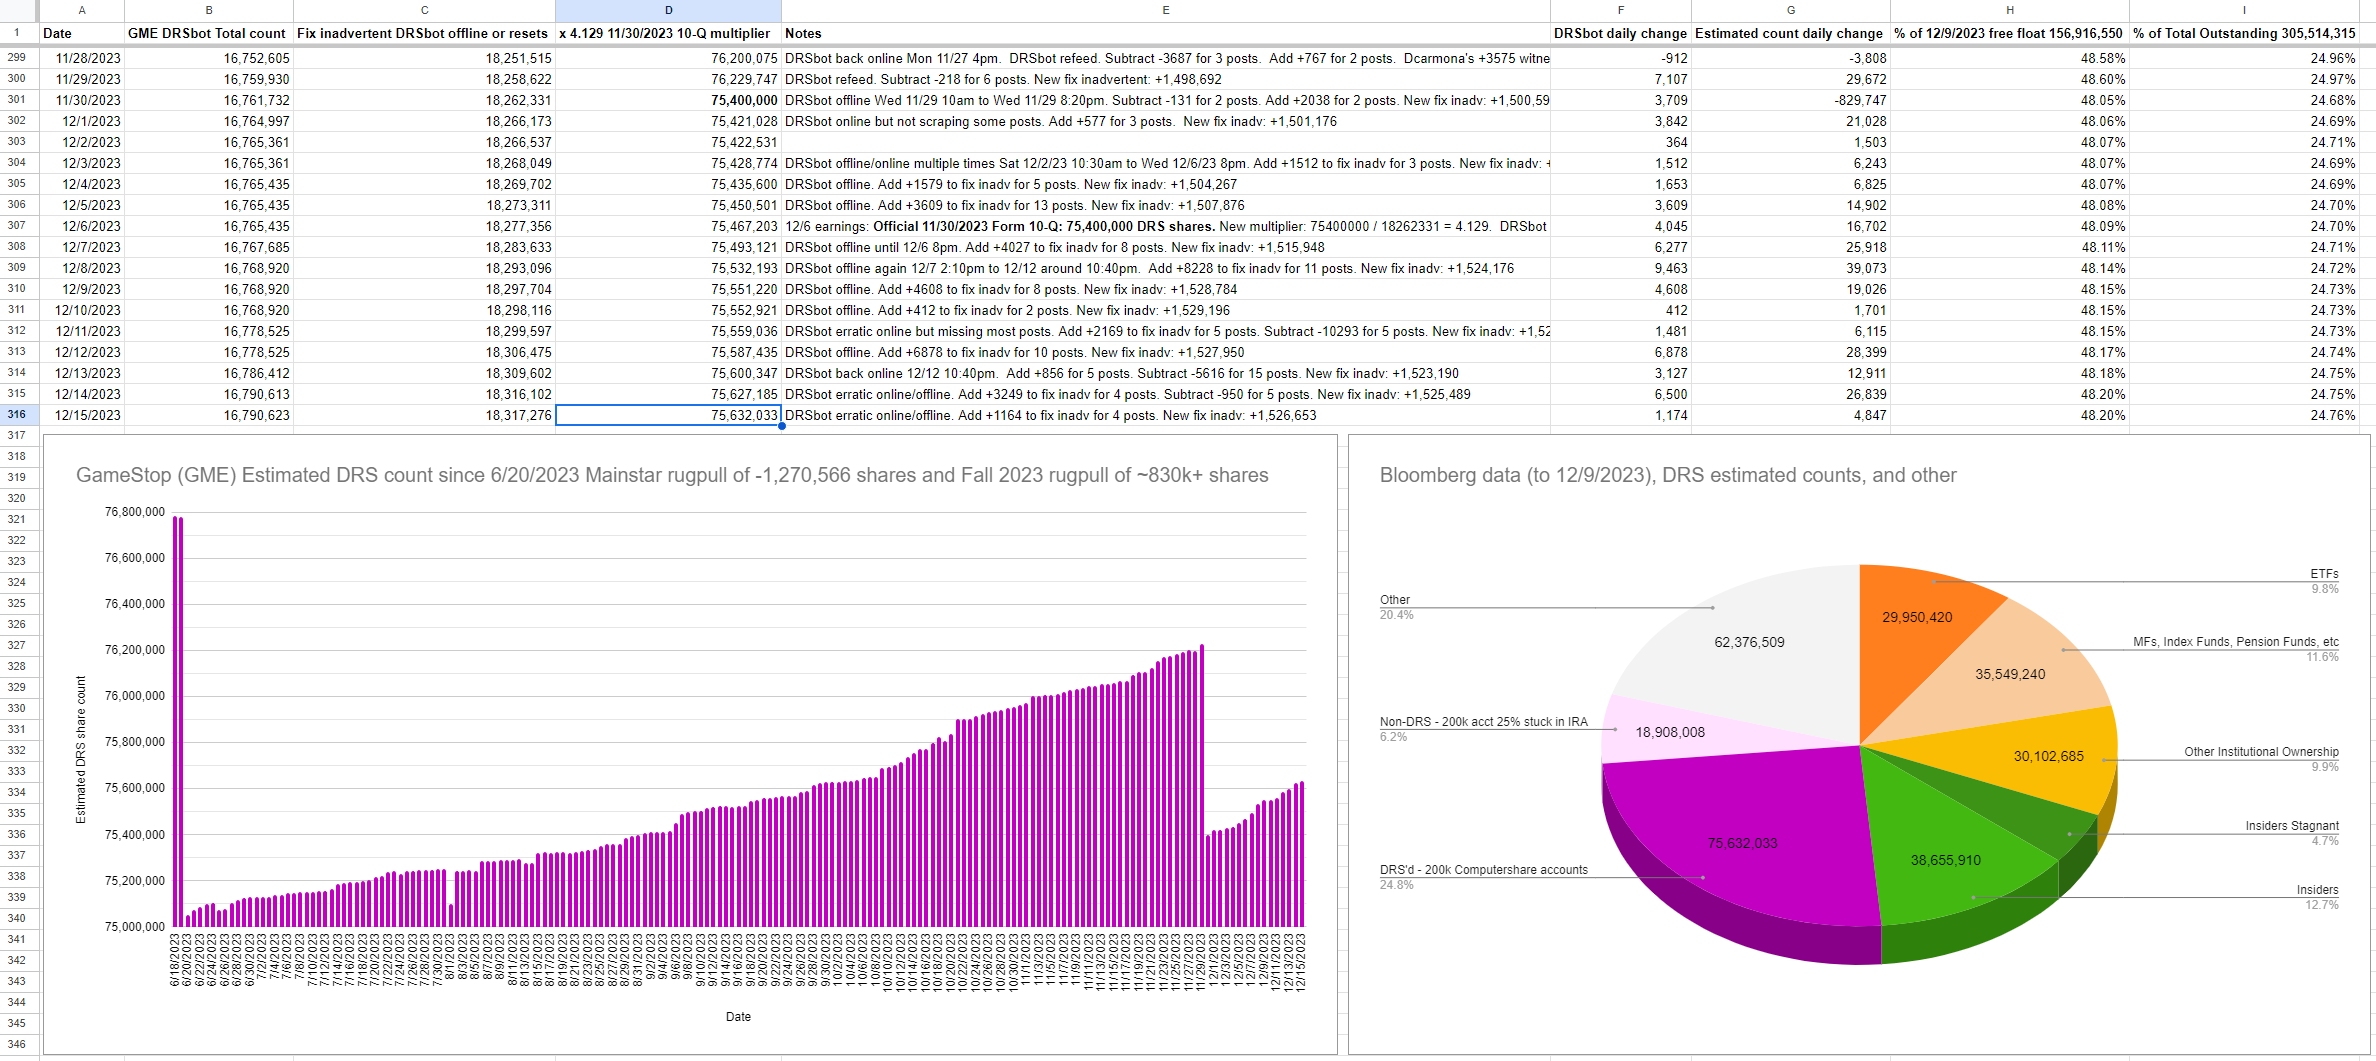
Bloomberg data (to 12/9/2023), 12/31/2023 Blackrock addition, 12/29/2023 Vanguard addition, DRS estimated count, stuck in IRA estimates, and other:
| Holding | Number of shares | As of |
|---|---|---|
| Former Insiders (Other) | 14,339,510 | 12/9/2023 |
| ETFs | 29,950,420 | 12/9/2023 |
| MFs, Index Funds, Pension Funds, etc | 36,902,186 | 2/13/2024 |
| Other Institutional Ownership | 30,102,685 | 12/9/2023 |
| Insiders | 38,655,910 | 12/9/2023 |
| DRS'd - 200k Computershare accounts | 76,100,046 | 2/23/2024 |
| Non-DRS - 200k acct if 30% stuck in IRA | 22,830,014 | 2/23/2024 |
| Non-DRS - 200k acct if 50% stuck in IRA | 15,220,009 | 2/23/2024 |
| Other | 41,413,535 | 2/23/2024 |
- Total Outstanding on 11/30/2023: 305,514,315
- Thank you to lawsondt for the Bloomberg data to 12/9/2023
- Vanguard increased shares by 785,823 on 12/29/2023 (2/13/2024 file date). From 24,664,433 to 25,450,256.
- Blackrock increased shares by 567,123 on 12/31/2023 (1/26/2024 file date). From 21,977,404 to 22,544,527.
- "Non-DRS - 200k acct if 30% stuck in IRA" is a conservative percentage. The Google share count surveys have suggested the 200k Computershare accounts have 40-50% additional shares stuck in IRAs.
- "Fix inadvertent DRSbot offline or resets" is primarily whale #1's 1,390,972 DRS shares (as of 1/4/2024). Long story of switching subs and losing her DRS share count. So added the "fix inadvertent" column to capture her DRS shares.
- Starting 1/4/2024, whale #1 started gift transferring DRS shares to others. 1,390,995 (on 12/25/2023) to now 1,390,972 (on 1/4/2024). Unfortunately, Computershare only allows one gift per month, and only up to $2000.
Discussion points:
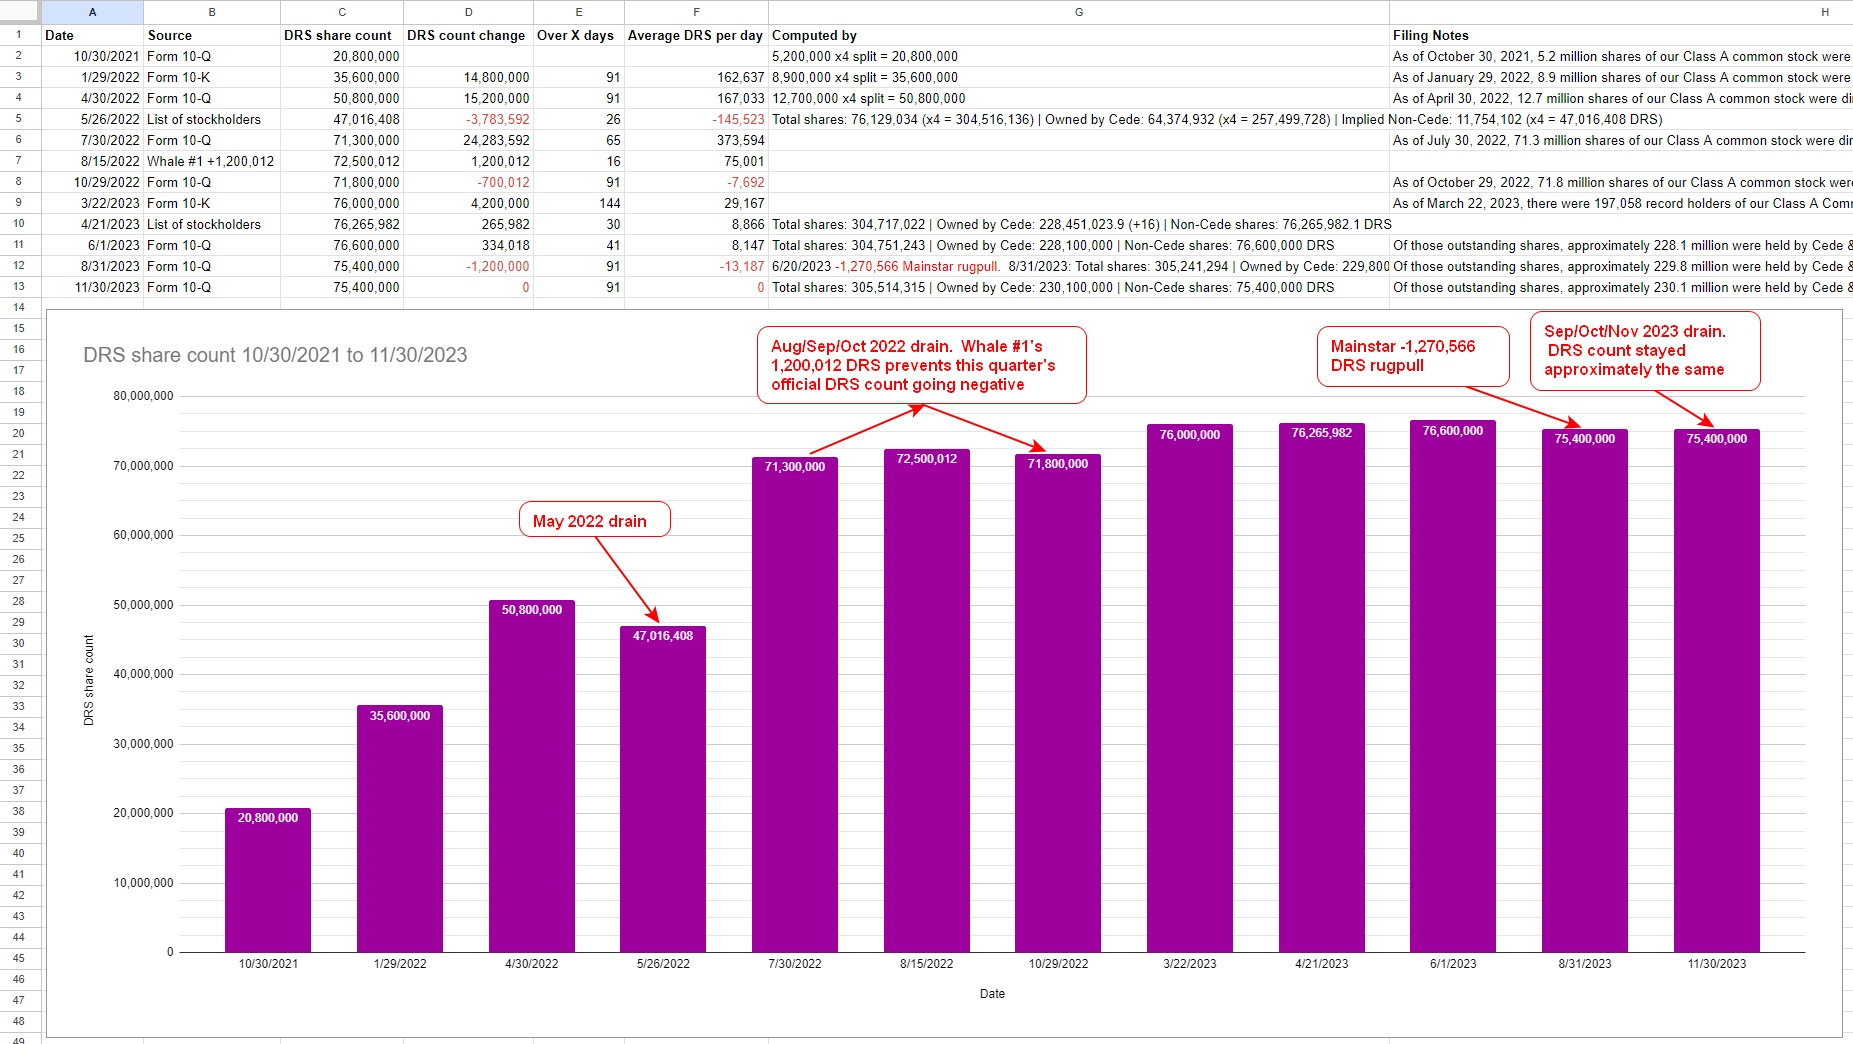
- It seems odd on some of the DRS count fluctuations since the beginning.
- There have been 2 "somewhat hidden" 2022 rugpulls (May 2022 and Aug/Sep/Oct 2022), the June 2023 Mainstar rugpull, and now the Sep/Oct/Nov 2023 rugpull.
- It seems odd on recent DRS count stagnating (excluding the Mainstar rugpull of 1.27 million shares). From a very simplistic view assuming 200,000 Computershare accounts:
| Buy X number of shares a month | Multiply by 3 months per quarter | Total DRS per quarter if 100,000 active accounts | Total DRS per quarter if 200,000 active accounts |
|---|---|---|---|
| 1 | 3 | 300,000 | 600,000 |
| 2 | 6 | 600,000 | 1,200,000 |
| 3 | 9 | 900,000 | 1,800,000 |
| 4 | 12 | 1,200,000 | 2,400,000 |
| 5 | 15 | 1,500,000 | 3,000,000 |
- The April 2023 list of stockholders DRS numbers seem correct and line up with SEC filings.
- Possible some investors have had to un-DRS.
- Possible economic slowdown and inflation have reduced investor purchasing power.
- Possible whale investors who helped inflate DRS numbers alot, have dramatically slowed down their purchasing.
- Tinfoil - certain parties inflate DRS shares 9 to 18 months back, then drain their DRS shares later. Probably spread across say 3,000 accounts to make it seem like normal activity.
- Tinfoil - operational efficiency draining from DRS non-Book shares on certain dates.
- Tinfoil - possible something funny with SEC filing reported number.
- There is the recent post from sister sub, google search on: Deep analysis on Computershare recurring buys reddit
He examines the bi-weekly recurring Computershare buys. The bi-weekly recurring buys were around $900k to $1.5 million.
An alternative DRS count estimation may be estimating money spent by retail purchasing GME per quarter. It was around $1.2 million average per 6 recurring Computershare buys per quarter. Then say a massively conservative $200k per other trading day. So:
If average $1.2 million spent per bi-weekly purchase, and say $14 a share, multiply by 6 for one GME quarter:
- 1,200,000 / 14 = 85,714 shares * 6 = 514,284 shares
- The 6 recurring buys alone should add 514,284 DRS shares.
Other 54 trading days:
- $200,000 / $14 a share = 14,285 shares a day
- 54 * 14,285 = 771,390 shares
Total:
514,284 + 771,390 = +1,285,674 DRS shares a quarter
Additional data #1:
2/23/2024 Top 50 holders from recent reddit activity:
- Using sample of 653 data points (2,458,580 DRS'd shares)
- Top 50 holders are 2,074,285 of the 2,458,580 DRS'd shares
| Position | Number of shares |
|---|---|
| 1 | 1,390,972 |
| 2 | 70,800 |
| 3 | 58,769 |
| 4 | 46,518 |
| 5 | 42,004 |
| 6 | 38,008 |
| 7 | 31,150 |
| 8 | 30,701 |
| 9 | 29,369 |
| 10 | 22,187 |
| 11 | 21,568 |
| 12 | 20,000 |
| 13 | 18,705 |
| 14 | 14,507 |
| 15 | 14,224 |
| 16 | 14,220 |
| 17 | 11,900 |
| 18 | 10,522 |
| 19 | 10,101 |
| 20 | 10,085 |
| 21 | 9,583 |
| 22 | 9,551 |
| 23 | 9,544 |
| 24 | 8,500 |
| 25 | 8,311 |
| 26 | 8,000 |
| 27 | 6,695 |
| 28 | 5,860 |
| 29 | 5,600 |
| 30 | 5,503 |
| 31 | 5,400 |
| 32 | 5,362 |
| 33 | 5,339 |
| 34 | 5,266 |
| 35 | 5,256 |
| 36 | 5,213 |
| 37 | 5,069 |
| 38 | 4,788 |
| 39 | 4,485 |
| 40 | 4,420 |
| 41 | 4,380 |
| 42 | 4,258 |
| 43 | 4,221 |
| 44 | 4,216 |
| 45 | 4,200 |
| 46 | 3,872 |
| 47 | 3,799 |
| 48 | 3,772 |
| 49 | 3,763 |
| 50 | 3,749 |
4/21/2023 List of stockholders top 25 holders (Credit: drs gme org contributors):
| Position | Who | Number of shares |
|---|---|---|
| 1 | Cede & Co | 228,451,023.9 |
| 2 | 1,200,009 | |
| 3 | 203,868.0026 | |
| 4 | 160,000 | |
| 5 | 146,896 | |
| 6 | 128,000 | |
| 7 | 109,812 | |
| 8 | 108,000 | |
| 9 | 108,000 | |
| 10 | GameStop Omnibus Account | 78,012 |
| 11 | 72,000 | |
| 12 | 66,000 | |
| 13 | 65,329 | |
| 14 | 61,536 | |
| 15 | 60,140 | |
| 16 | 60,000 | |
| 17 | 60,000 | |
| 18 | 58,000 | |
| 19 | 57,884 | |
| 20 | 57,065.16734 | |
| 21 | 55,840 | |
| 22 | 55,479.32866 | |
| 23 | 53,000.09312 | |
| 24 | 51,600 | |
| 25 | 50,810.5893 |
2/23/2024 Insider share count via SEC Form 4 filings:
| Who | Number of shares | As of |
|---|---|---|
| Ryan Cohen | 36,847,842 | 6/9/2023 |
| Patel Nir Vinay | 1,004,695 | 7/10/2023 |
| Alain Attal | 562,464 | 9/8/2023 |
| Mark Robinson | 68,687 | 1/2/2024 |
| Lawrence Cheng | 55,088 | 9/8/2023 |
| James Grube | 23,864 | 6/15/2023 |
| Daniel Moore | 22,963 | 1/2/2024 |
| Xu Yang | 19,860 | 6/15/2023 |
Additional data #2:
Number of Computershare accounts:
| Date | Number of Computershare accounts |
|---|---|
| 5/8/2023 | 213,4xx |
| 8/2023 or 9/2023 | 213,500 |
| 10/24/2023 | 216,3xx |
| 11/21/2023 | 217,xxx |
| 12/10/2023 | 218,xxx |
| 1/4/2024 | 218,4xx |
Number of record holders:
| Date | Source | Number of record holders |
|---|---|---|
| 3/11/2022 | Form 10-K | 125,543 |
| 3/22/2023 | Form 10-K | 197,058 |
| 4/21/2023 | List of stockholders | 197,954 |
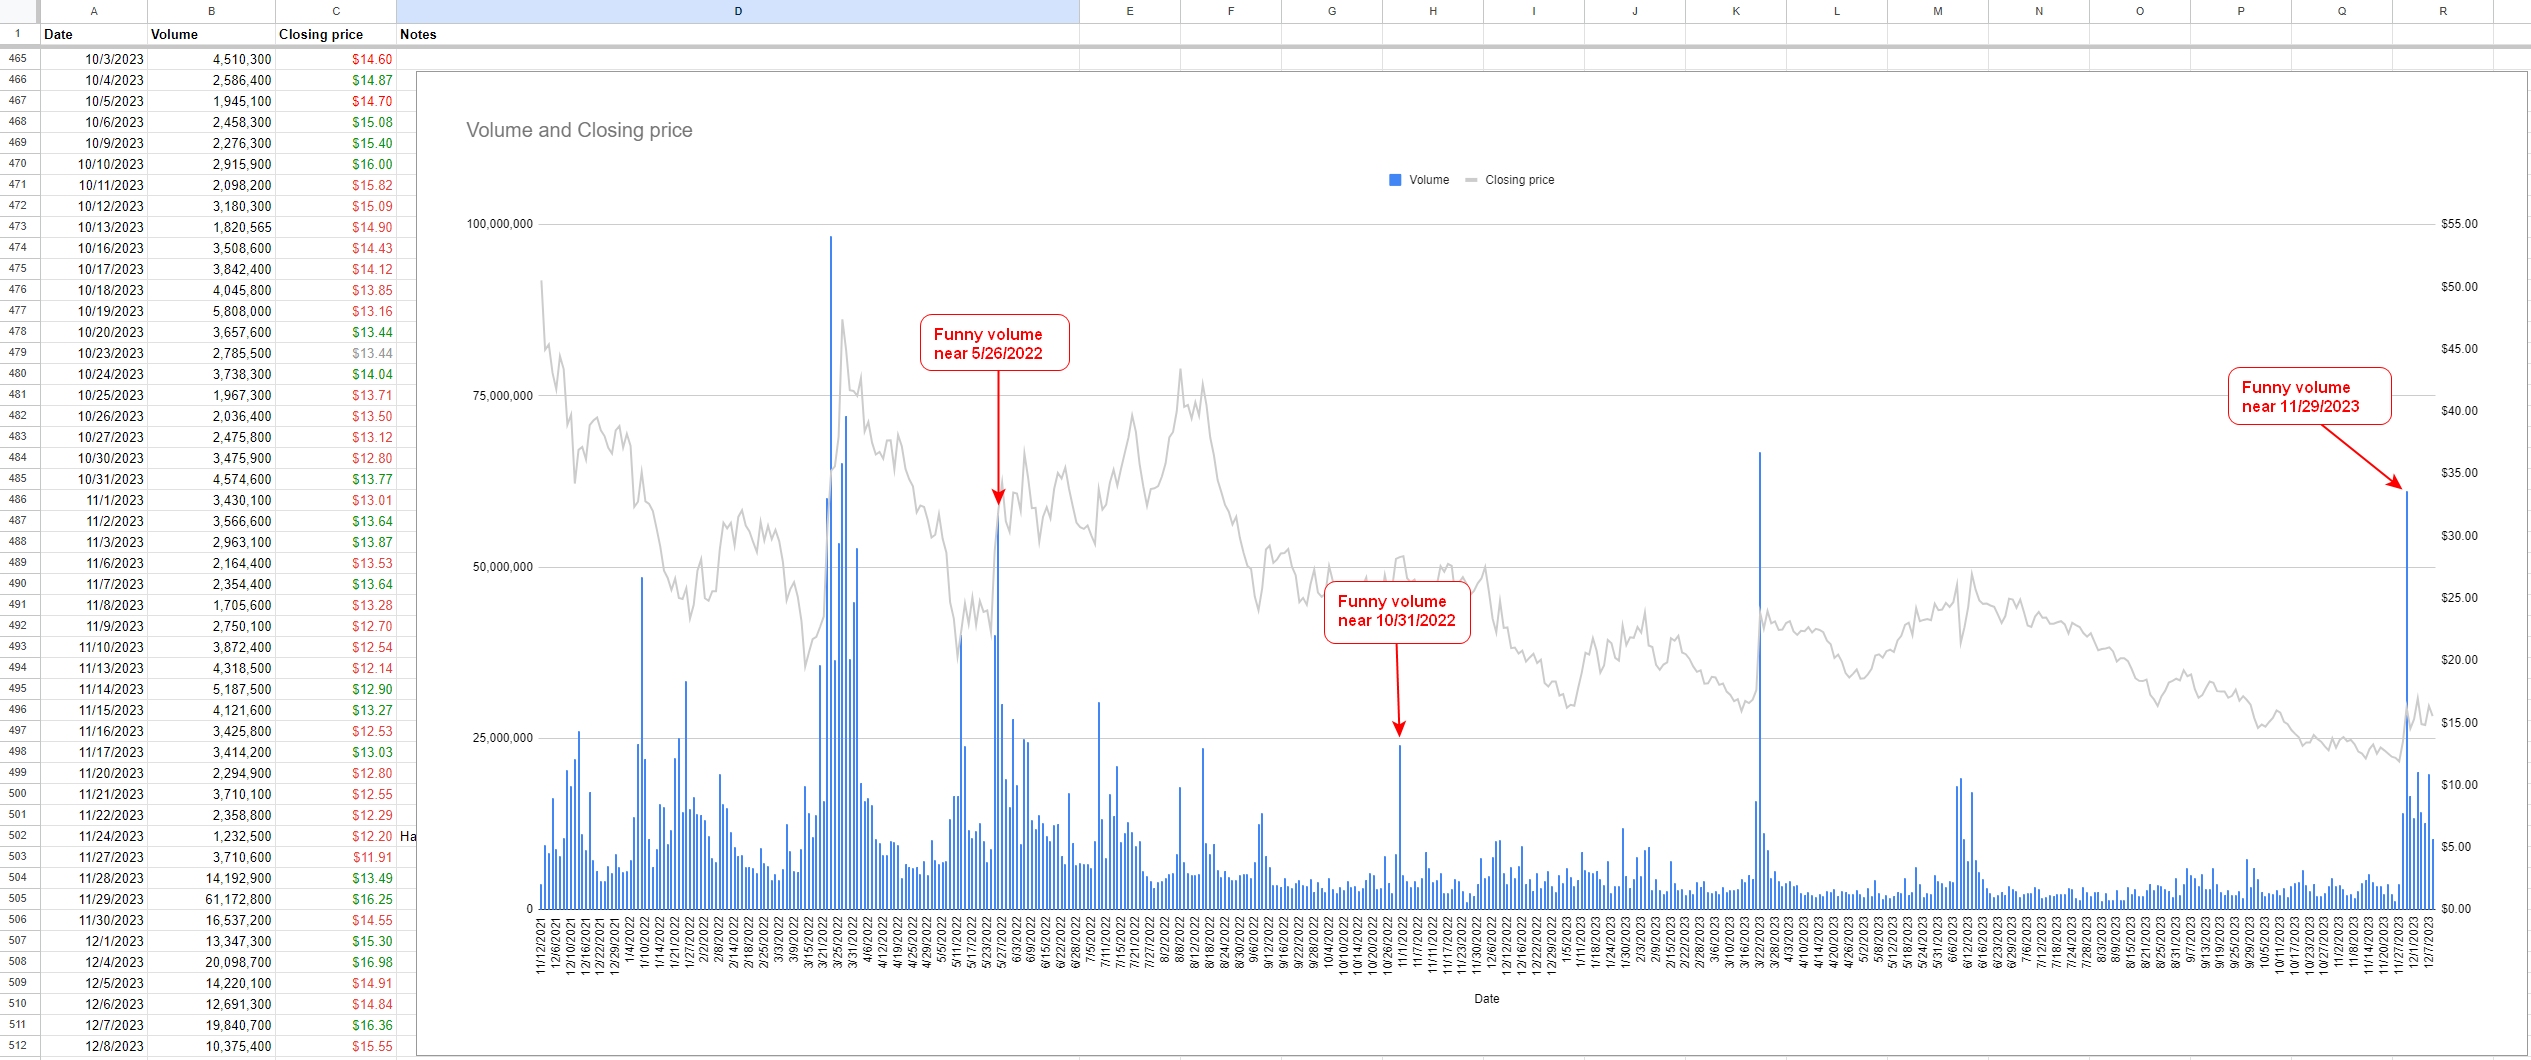
GME Volume last 2 years:
| Year | Volume |
|---|---|
| 2022 | 2,825,293,700 |
| 2023 | 1,167,878,465 |
20 lowest volume days (as of 2/22/2024):
| Rank | Date | Volume | Closing price |
|---|---|---|---|
| 1 | 8/3/2023 | 1,318,700 | $20.93 |
| 2 | 8/8/2023 | 1,431,300 | $20.74 |
| 3 | 8/10/2023 | 1,432,400 | $20.19 |
| 4 | 8/7/2023 | 1,441,300 | $21.07 |
| 5 | 7/26/2023 | 1,489,200 | $22.70 |
| 6 | 8/11/2023 | 1,500,200 | $20.19 |
| 7 | 5/9/2023 | 1,522,700 | $20.24 |
| 8 | 5/11/2023 | 1,652,500 | $20.88 |
| 9 | 1/30/2024 | 1,652,600 | $14.55 |
| 10 | 7/25/2023 | 1,672,000 | $22.85 |
| 11 | 9/27/2023 | 1,681,300 | $17.15 |
| 12 | 11/8/2023 | 1,705,600 | $13.28 |
| 13 | 2/21/2024 | 1,731,300 | $13.41 |
| 14 | 7/12/2023 | 1,742,200 | $23.44 |
| 15 | 4/13/2023 | 1,803,900 | $22.55 |
| 16 | 7/3/2023 | 1,806,600 | $24.91 |
| 17 | 2/22/2024 | 1,810,000 | $13.36 |
| 18 | 10/13/2023 | 1,820,565 | $14.90 |
| 19 | 2/8/2024 | 1,838,300 | $14.35 |
| 20 | 8/30/2023 | 1,884,500 | $18.37 |

Are you me? 😄 I was looking over the 10-Q (again) on Friday night. More of a "How is the stock price down 65% since stock split via dividend when all the SEC filing numbers are better than ever?"
We all know the answer, but I just have to remind myself.