Previous posts: https://programming.dev/post/3974121 and https://programming.dev/post/3974080
Original survey link: https://forms.gle/7Bu3Tyi5fufmY8Vc8
Thanks for all the answers, here are the results for the survey in case you were wondering how you did!
Edit: People working in CS or a related field have a 9.59 avg score while the people that aren’t have a 9.61 avg.
People that have used AI image generators before got a 9.70 avg, while people that haven’t have a 9.39 avg score.
Edit 2: The data has slightly changed! Over 1,000 people have submitted results since posting this image, check the dataset to see live results. Be aware that many people saw the image and comments before submitting, so they've gotten spoiled on some results, which may be leading to a higher average recently: https://docs.google.com/spreadsheets/d/1MkuZG2MiGj-77PGkuCAM3Btb1_Lb4TFEx8tTZKiOoYI
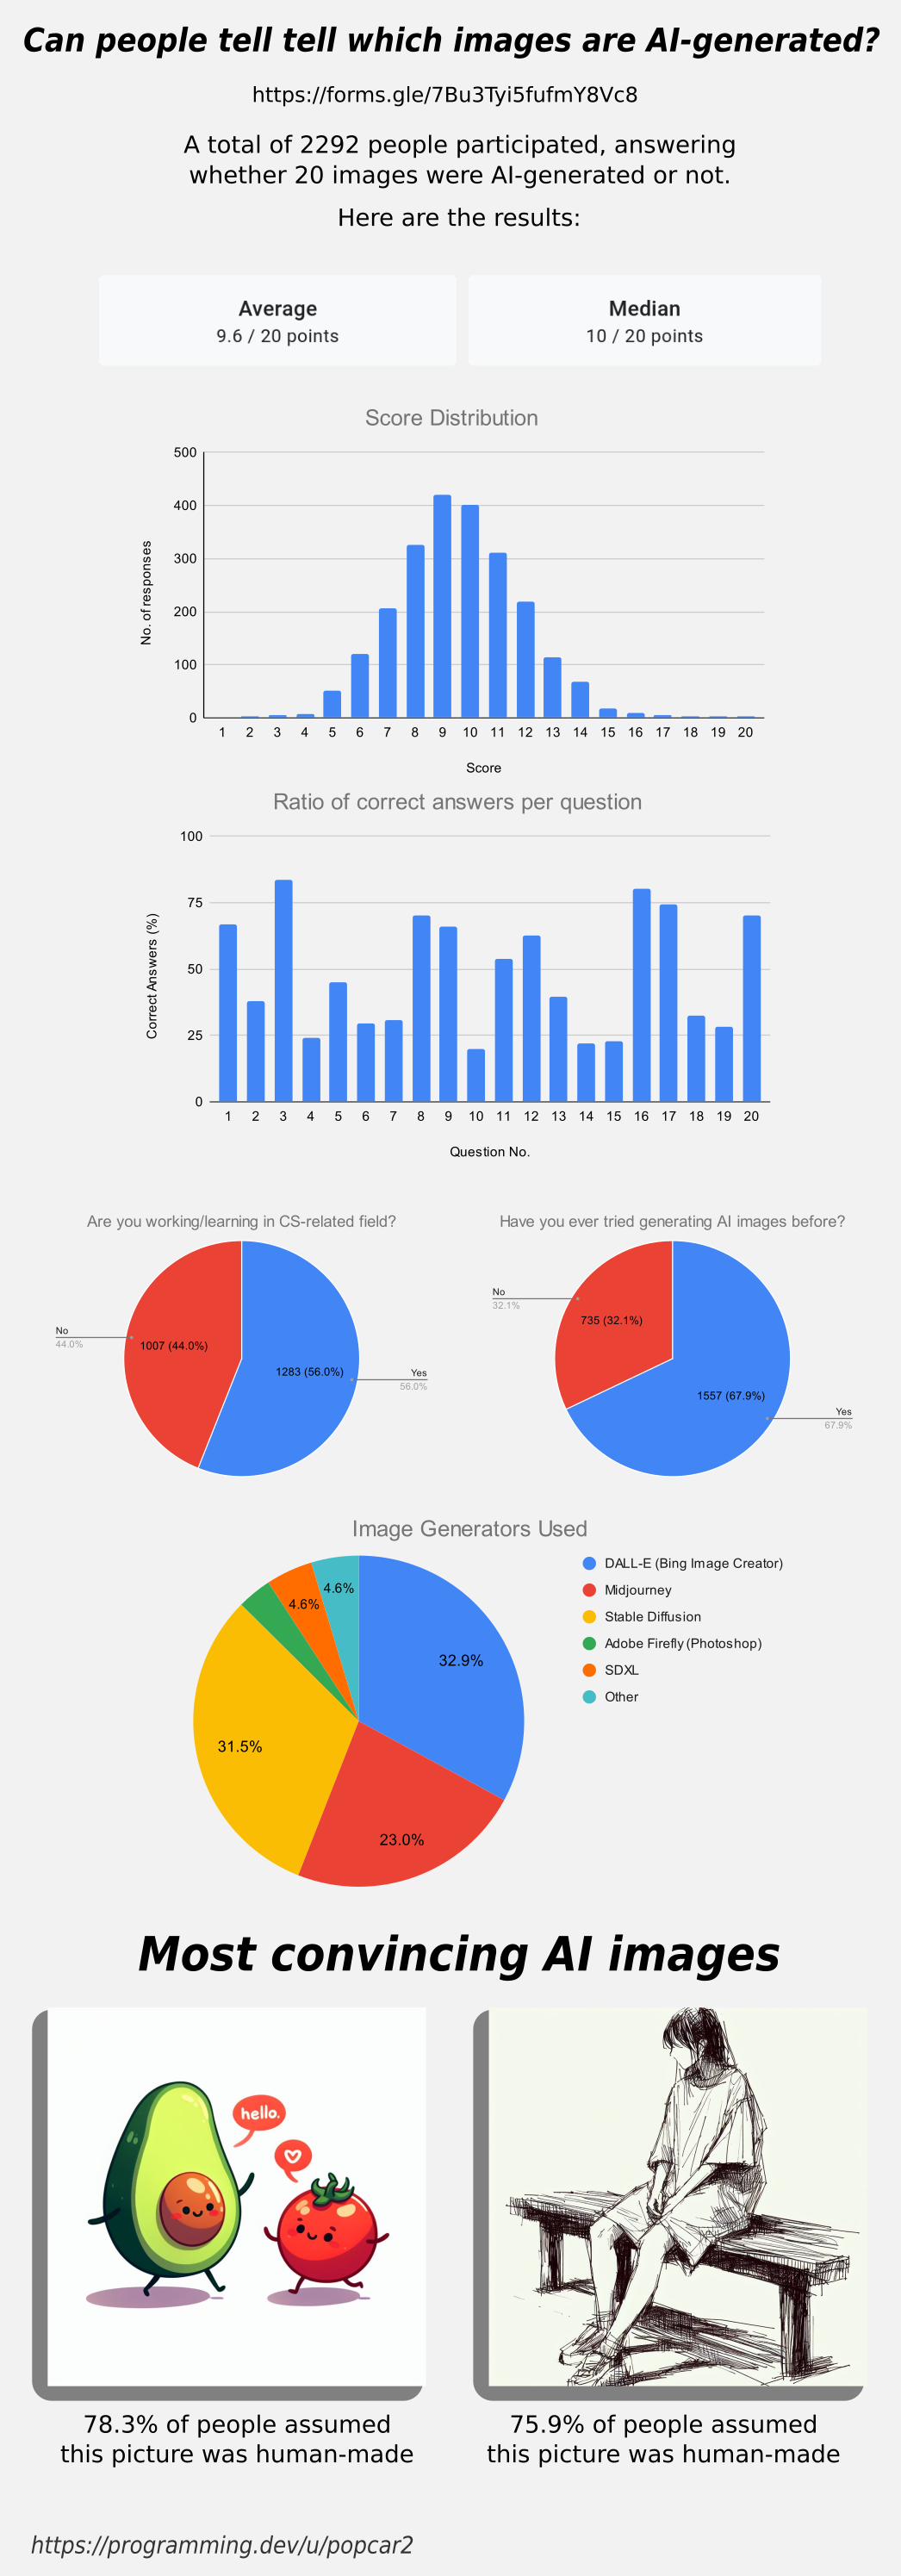
If you look at the ratios of each picture, you’ll notice that there are roughly two categories: hard and easy pictures. Based on information like this, OP could fine tune a more comprehensive questionnaire to include some photos that are clearly in between. I think it would be interesting to use this data to figure out what could make a picture easy or hard to identify correctly.
My guess is that a picture is easy if it has fingers or logical structures such as text, railways, buildings etc. while illustrations and drawings could be harder to identify correctly. Also, some natural structures such as coral, leaves and rocks could be difficult to identify correctly. When an AI makes mistakes in those areas, humans won’t notice them very easily.
The number of easy and hard pictures was roughly equal, which brings the mean and median values close to 10/20. If you want to bring that value up or down, just change the number of hard to identify pictures.
This is true if "hard" means "it's trying to get you to make the wrong answer" as opposed to "it's so hard to tell, so I'm just going to guess."
That’s a very important distinction. Hard wasn’t the clearest word for that use. I guess I should have called it something else such as deceptive or misleading. The idea is that some pictures got a below 50% ratio, which means that people were really bad at categorizing them correctly.
There were surprisingly few pictures that were close to 50%. Maybe it’s difficult to find pictures that make everyone guess randomly. There are always a few people who know what they’re doing because they generate pictures like this on a weekly basis. The answers will push that ratio higher.
A great example of the below 50% situation is the picture of the avocado and the tomato. I was confident that that was AI generated because I was pretty sure I'd seen that specific picture used as an example of how good Dall-E 3 was at normal text. However, most people who had used other models were probably used to butchered text and expected that one to be real.
If they did this quiz again with only pictures that were sketches, I bet the standard deviation would be much smaller.