One of the most important decisions you face as a forecaster is simply when to publish a statistical model for public consumption. If you’re just running a model for your personal edification — or to make bets with — the threshold may actually be lower. If you’re evaluating the impact of a player injury on an NFL or NBA game that you’re considering betting on, for instance, then you might only get a couple of minutes before some reasonably rational assessment of the impact has already been priced into prevailing betting lines. Under these circumstances, a good first-pass estimate can go a long way. By the time you dot all the ‘i’s and cross all the ‘t’s to incorporate the impact of the injury into a formal model, it may be too late.
When you issue a statistical forecast publicly, though, I think the responsibility is slightly greater. In some cases, probabilistic forecasts can be confusing to people. And in other circumstances, people can take statistical models too seriously and treat them as oracular when in fact all models rely on the researcher’s assumptions. Let’s not get too carried away with this — some assumptions are better than others, which is why some models are better than others. (And putting a model behind a paywall is a pretty useful trick for self-selecting a more knowledgeable reader base.) But there are times when a subjective estimate may be better, especially in unforeseen circumstances that your model wasn’t really designed to handle.
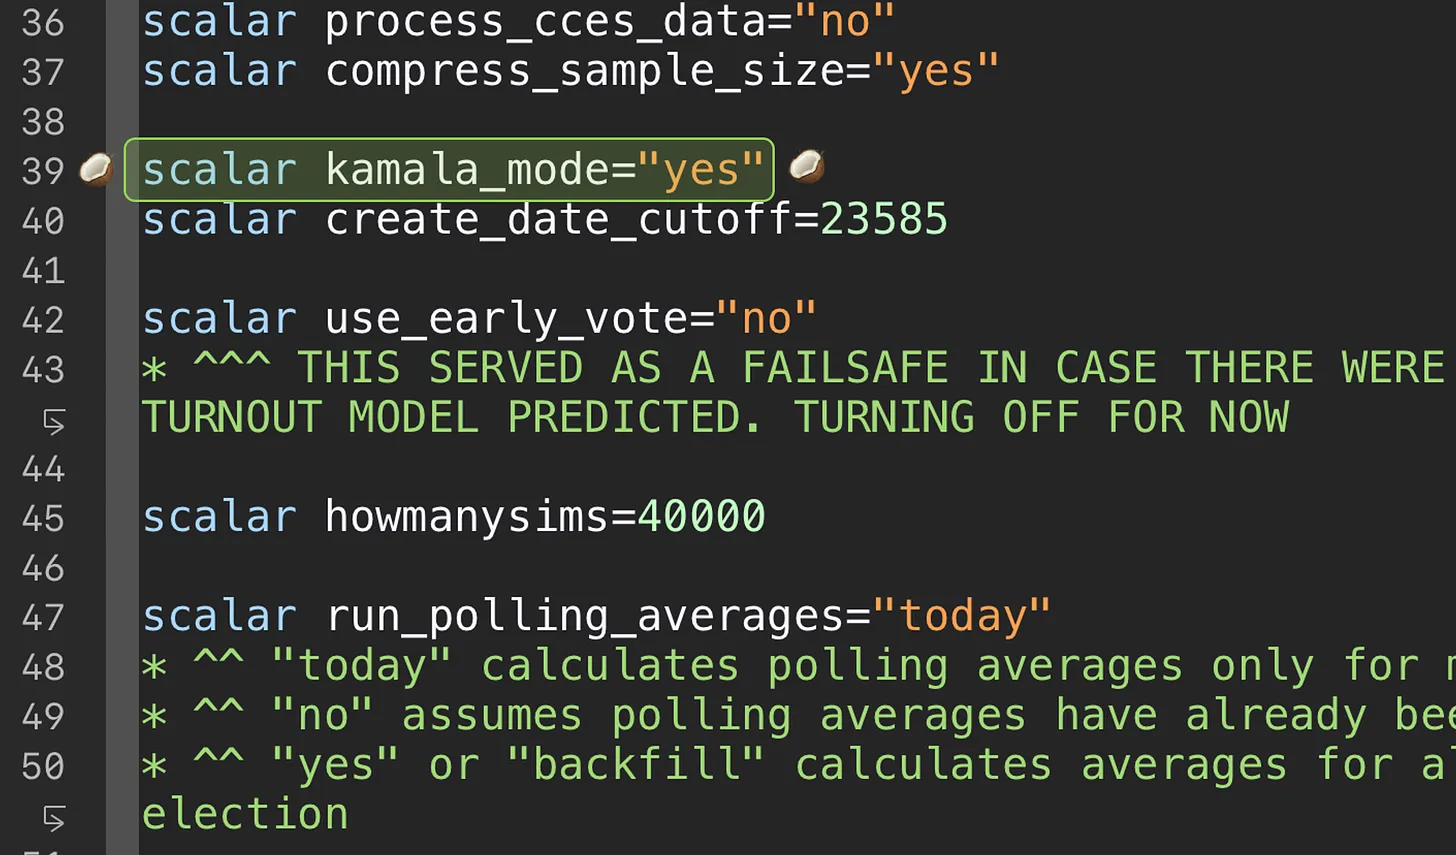
For instance, when Joe Biden dropped out of the presidential race last Sunday, I suppose we could have just done a hot swap and immediately replaced him with Kamala Harris — pollsters have periodically tested the Harris vs. Trump matchup, especially since Biden’s disastrous debate on June 27. But I think this would have misinformed even our smart, self-selected group of Silver Bulletin readers more than it informed them. The polls were already in flux, given Biden’s mounting crisis on top of the assassination attempt against Trump on top of the Republican convention, which is typically a period when polls can produce short-lived bounces. And Harris’s candidacy was still hypothetical, although she was clearly prepared, working behind the scenes to become the Democrats’ presumptive nominee within 24-48 hours.