OpenStreetMap community

4115 readers
12 users here now

Everything #OpenStreetMap related is welcome: software releases, showing of your work, questions about how to tag something, as long as it has to do with OpenStreetMap or OpenStreetMap-related software.

OpenStreetMap is a map of the world, created by people like you and free to use under an open license.

Join OpenStreetMap and start mapping: https://www.openstreetmap.org.

There are many communication channels about OSM, many organized around a certain country or region. Discover them on https://openstreetmap.community

https://mapcomplete.org is an easy-to-use website to view, edit and add points (such as shops, restaurants and others)

https://learnosm.org/en/ has a lot of information for beginners too.

founded 4 years ago
MODERATORS
1


Make Vector Topographic Maps (Open Street Map, Maperitive, and Inkscape)

by Michael Altfield

This guide will show you how to generate vector-based topopgraphic maps, for printing very large & high-quality paper wall maps using inkscape. All of the tools used in this guide are free (as in beer).

How-to Guide to Making Vector Topo Maps with Maperitive and Inkscape

Intro

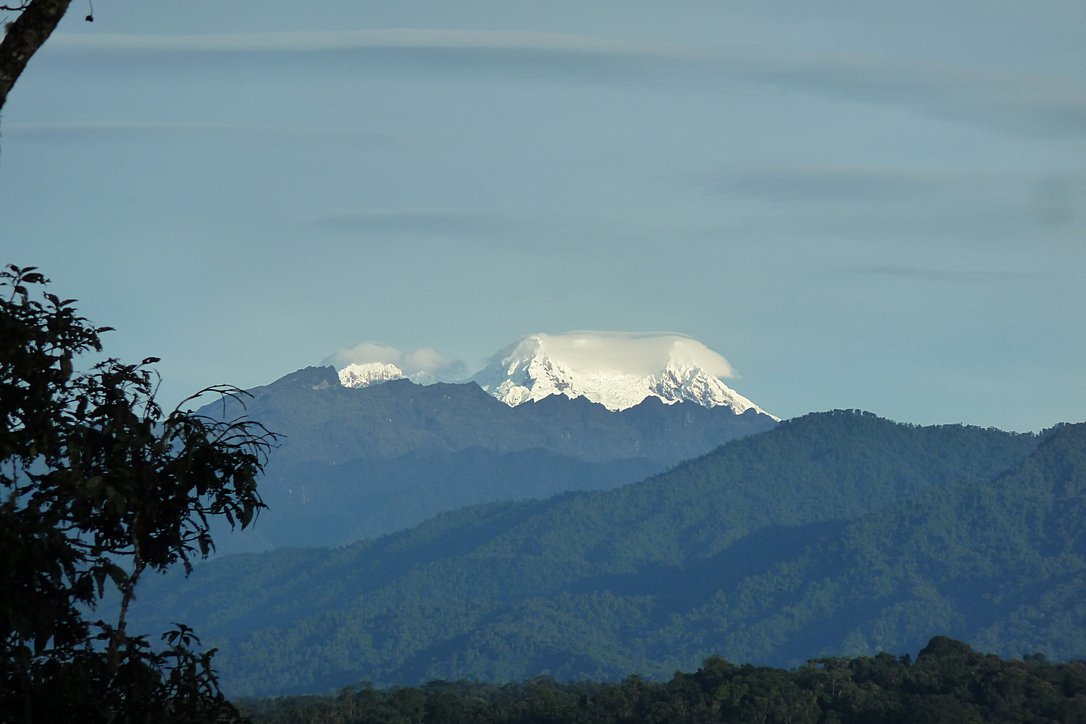
I recently volunteered at a Biological Research Station located on the eastern slopes of the Andes mountains. If the skies were clear (which is almost never, as it's a cloud forest), you would have a great view overlooking the Amazon Rainforest below.

Photo of a lush green, mountainous forest. In the background is a glacial-covered summit.
Yanayacu is in a cloud forest on the east slopes of the Andes mountains, just 30 km from the summit of the glacial-capped Antisana volcano (source)

The field station was many years old with some permanent structures and a network of established trails that meandered towards the border of Antisana National Park -- a protected area rich with biodiversity that attracts biologists from around the world. At the top of the park is a glacial-capped volcano with a summit at 5,753 meters.

Surprisingly, though Estacion Biologicia Yanayacu was over 30 years old, nobody ever prepared a proper map of their trails. And certainly there was no high-resolution topographical map of the area to be found at the Station.

That was my task: to generate maps that we could bring to a local print shop to print-out huge 1-3 meter topographical maps.

And if you want to print massive posters that don't look terrible, you're going to be working with vector graphics. However, most of the tools that I found for browsing Open Street Map data that included contour lines couldn't export an SVG. And the tools I found that could export an SVG, couldn't export contour lines.

It took me several days to figure out how to render a topographical map and export it as an SVG. This article will explain how, so you can produce a vector-based topographical map in about half a day of work.

Assumptions

This guide was written in 2024, and it uses the following software and versions:

  1. Debian 12 (bookworm)
  2. OsmAnd~ v4.7.10
  3. JOSM v18646
  4. Maperitive v2.4.3
  5. Inkscape v1.2.2

The Tools

Unfortunately, there's no all-in-one app that will let you just load a slippy map, zoom-in, draw a box, and hit "export as SVG". We'll be using a few different tools to meet our needs.

OsmAnd
OsmAnd

OsmAnd

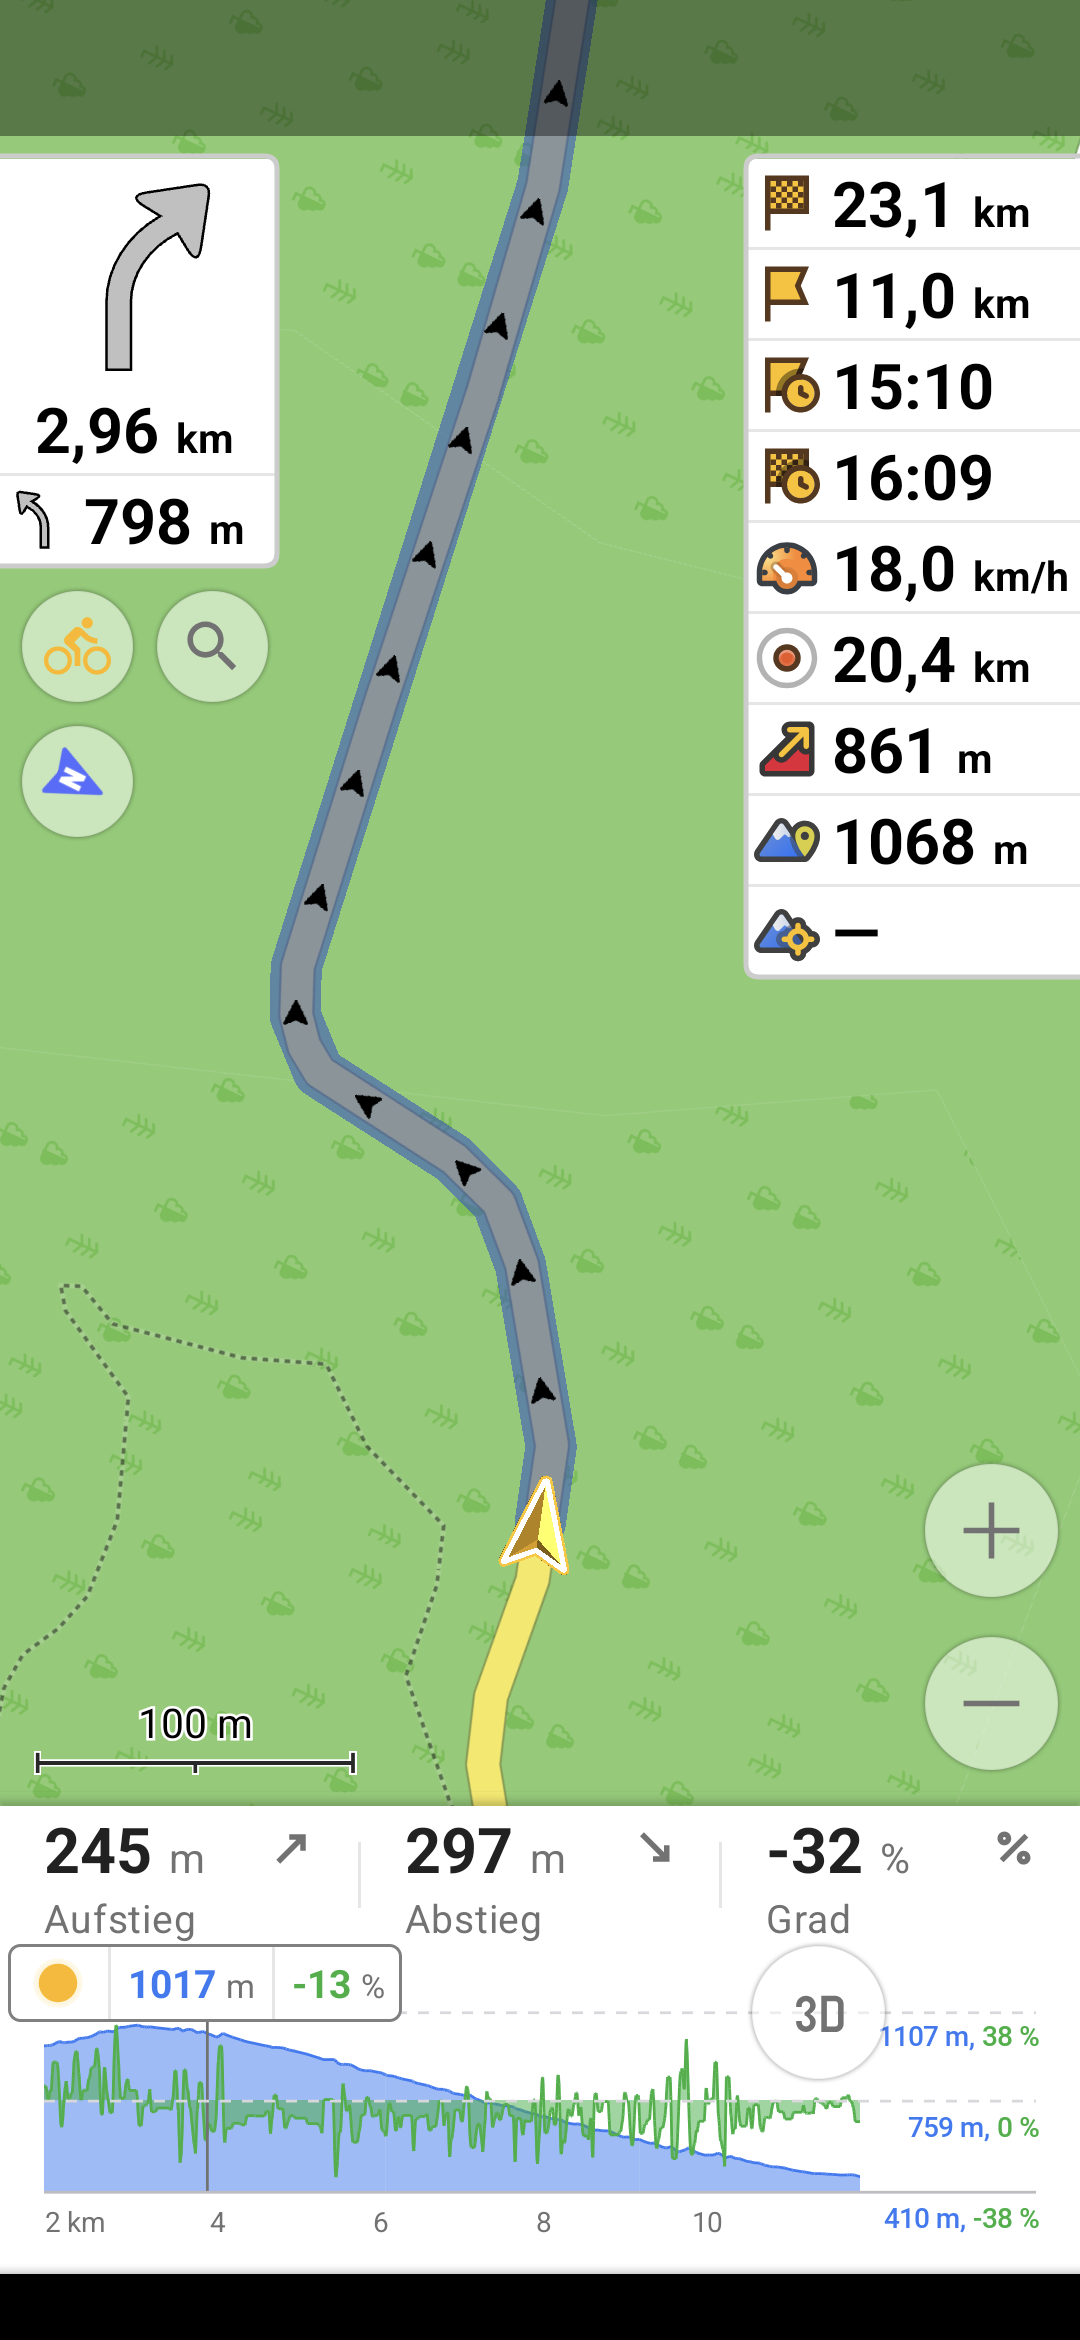
OsmAnd is a mobile app.

We'll be using OsmAnd to walk around on the trails and generate GPX files (which contain a set of GPS coordinates and some metadata). We'll use these coordinates to generate vector lines of a trail overlaying the topographic map.

If you just want a topographic map without trails (or your trails are already marked on OSM data), then you won't need this tool.

In this guide we'll be using OsmAnd, but you an also use other apps -- such as Organic Maps, Maps.me, or Gaia.

JOSM
JOSM

JOSM

JOSM is a java-based tool for editing Open Street Map data.

We'll be using JOSM to upload the paths of our trails (recorded GPX files from OsmAnd) and also to download additional data (rivers, national park boundary line, road to the trailhead, etc). We'll then be able to combine all of this data into a larger GPX file, which will eventually become vector lines overlaying the topographic map.

You can skip this if you just want contour lines without things like rivers, roads, trails, buildings, and park borders.

View Finder Panoramas

Have you ever wondered how you can zoom-in almost anywhere in the world and see contour lines? I always thought that this was the result of some herculean effort of surveyors scaling mountains and descending canyons the world-over. But, no -- it's a product of the US Space Shuttle program.

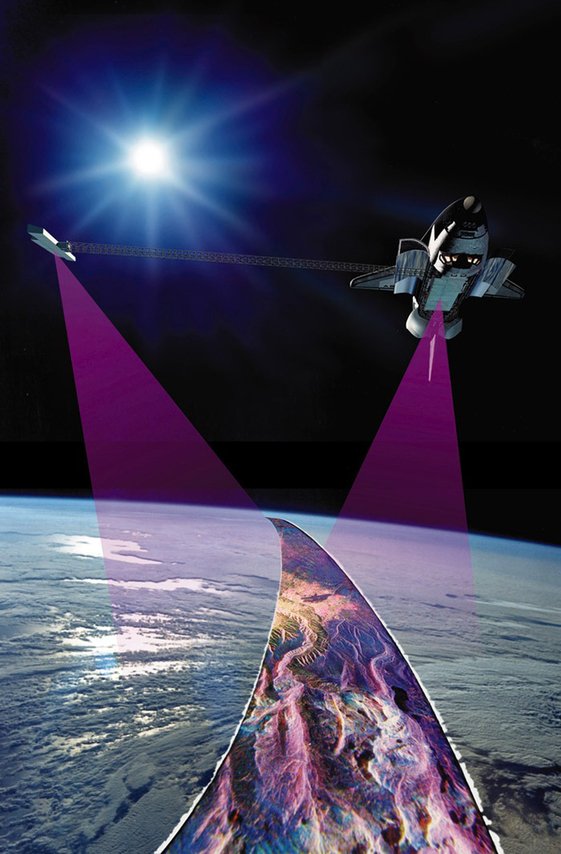
In the year 2000, an international program called SRTM (Shuttle Radar Topography Mission) was launched into space with the Endaevor Space Shuttle. It consisted of a special radar system tethered to the shuttle with a 60 meter mast as it orbited the earth.

Artist rendering shows a space shuttle with a purple beam emanating from it to a blue, cloudy sphere below. Attached to the shuttle is a long mast with a device at the end of it, where another purple beam emanates down to the same point on Earth, at a different angle.
This illustration shows the Space Shuttle Endeavour orbiting ~233 kilometers above Earth. The two anternae, one located in the Shuttle bay and the other located on a 60-meter mast, were able to penetrate clouds, obtaining 3-dimentional topographic images of the world's surface (source: NASA)

When the shuttle returned to earth, the majority of our planet's contours were mapped. This data was placed on the public domain. Today, it is the main data source for elevation data in most maps.

While the data from SRTM was a huge boon to cartographers, it did have some gaps. Namely: elevation data was missing in very tall mountains and very low canyons. Subsequent work was done to fill-in these gaps. One particular source that ingested the SRTM data, completed its gaps, and made the results public is Jonathan de Ferranti's viewfinderpanoramas.org.

We will be downloading .hgt files from View Finder Panoramas in order to generate vector contour lines for our topographical map.

Maperitive
Maperitive

Maperitive

Maperitive is a closed-source .NET-based mapping software (which runs fine in Linux with mono).

We'll be using Maperitive to tie together our GPX tracks, generate contour lines, generate hillshades, and export it all as a SVG.

Inkscape
Inkscape

Inkscape

Inkscape is a cross-platform app for artists working with vector graphics.

We'll be using inkscape to make some final touches to our vector image, such as hiding some paths, changing their stroke color/shape/thickness, and adding/moving text labels. Finally, we'll use inkscape to export a gigantic, high-definition .png raster image (to send to the print shop).

Guide

To read the full guide on how to create vector-based maps, click here:

Example Maps

For example, here's the (A4-sized) topo map that I built for Yanayacu.

Image shows a topographical map of a mountainous area. The title reads \"Yanayacu\". The elevation ranges from 2,100 to 2,900. The bottom-left has a small font that reads \"Map by Michael Altfield / github.com/maltfield/yanayacu\"
Final (raster) export, ready for sending to the print shop (source svg)

Note that I changed the stroke and thickness of the National Park boundary to be large and green, I changed the path of the road (downloaded from OSM data in JOSM) to be thick and black, and I changed my GPX tracks (recorded in OsmAnd and merged with the OSM data in JOSM) to be thin, dashed, and red.

The source .svg file for the above image can be found here

I also used this method to generate a simplified "trail map" of Yanayacu (without contour lines). The workflow was similar, except I didn't generate contour nor hillshades layers in Maperitive before exporting as a .svg
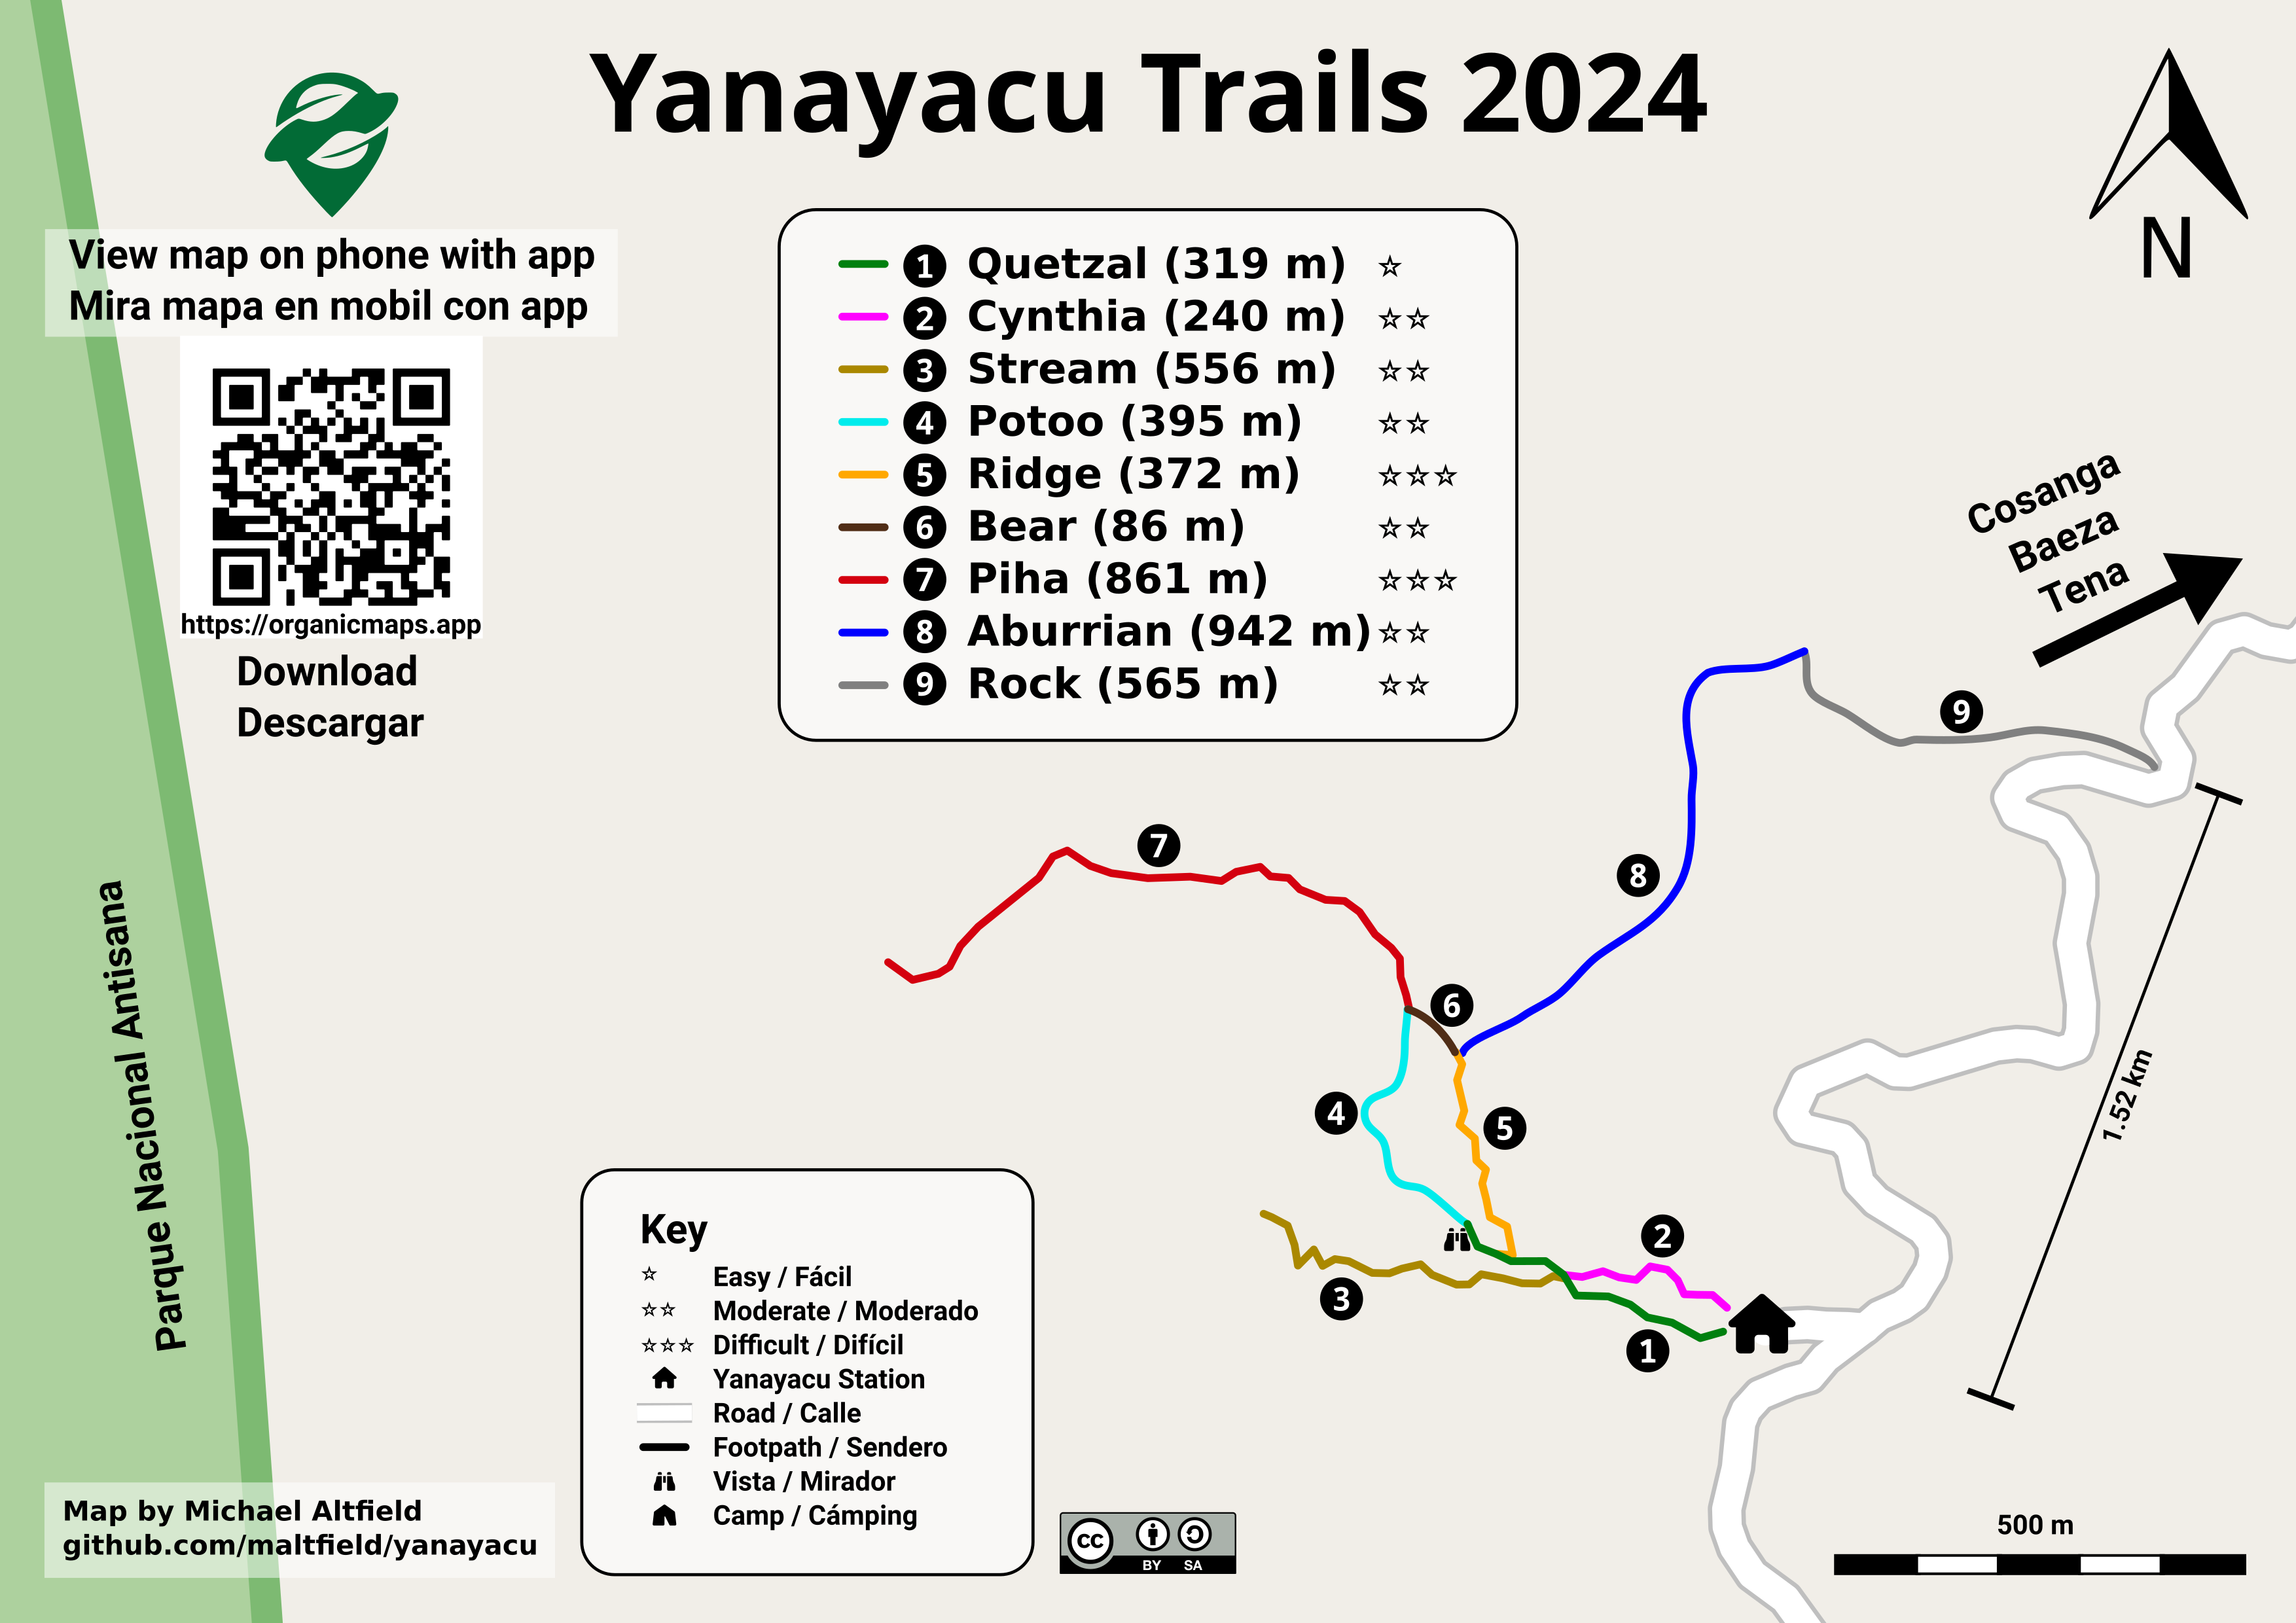
Image shows a \"trail guide\" map. The title reads \"Yanayacu Trails 2024\". The bottom-left has a small font that reads \"Map by Michael Altfield / github.com/maltfield/yanayacu\")
Yanayacu Trail Guide (source svg)

The source .svg file for the above image can be found here

2


@[email protected]

made my first #opendata contributions to @[email protected] yesterday. Pull request dopamine AND alternative reality game dopamine? Sign me up

(#foss @organicmaps is terrific both at navigation and mapping)

3
4


I am using a fresh osmand install, and now I have this widget on the right showing the wrong altitude. Always about 50m too high. The bottom widget shows the correct altitude however, that is kinda weird. I have updated the app now, but same thing.

Using f-droid latest version, but this happened also with the one I had before (4.85). I am also using brouter plugin for navigation, maybe the correct altitude comes from there idk. The wrong one is also displayed when in the default profile with no brouter involved.

Anybody else seeing this phenomenon?

Oh and the "centre map" altitude doesn't seem to be working at all, but I don't need that anyway.

5
10
submitted 1 week ago* (last edited 3 days ago) by [email protected] to c/[email protected]
6
7


I've been playing around with Google Maps lately to create custom maps.

I don't like google but have no experience with any other apps and have never tried mapping of any sort before.

I'm trying to create a map layer(s) that has historic sites, stone circles, woodland, cemeteries, UNESCO sites etc. So if I'm traveling I can stop and see them.

I've created my own Google Map using lists of sites from Wikipedia. This has gone ok but leads to a lot of data cleansing and the functionality isn't great.

I've seen this website but it isn't as complete as the Wikipedia text lists ive imported: https://www.hmdb.org/

I'm completely new to this and have no experience. Are there any good resources out there for me to use or contribute to?

I'd like to de-google as much as possible.

P.S. do I need to enable developer mode or root my phone to install open street map now?

Thanks!

8


@openstreetmap A while ago I've seen a before-after screenshot command line tool for osm mentioned somewhere but I cannot find it anymore.
I believe it was written in python.
Does anyone know the name of the tool in question?

#OSM #OpenStreetMap

Edit: Thanks to @richlv , this is it: https://github.com/amandasaurus/osm-mapping-party-before-after

9
10


When I read about Overture Maps like a year or 2 ago, it seemed to me that basically they were going to create a whole new thing from scratch.

Let's be honest, with enough resources, it's easy to see that they could pull off some kind of OpenStreetMap 2.0, where all the issues from OSM are modernised and cleaned up.

What's really going on? Are we getting something soon from these people? What's the relationship with them?

On their website, they say "coming this fall". Are you excited? Scared? What should I think?

11


I've encountered some conflicting usages of Tag:landuse=residential. Some areas are very specific, and broken down into individual blocks, while some areas cover multiple blocks. Here's an example of both styles adjacent to each other:

https://www.openstreetmap.org/way/653823458

https://www.openstreetmap.org/way/652122607

The wiki doesn't really say much on the topic. Does anyone have opinions/rules of thumb on how to tag them exactly? It seems like all adjacent areas not separated by major highways should be joined together?

I've encountered some residential areas that are broken down into mapping each block, and literally follow the curb, rounded corners and all. That seems too specific?

12


I'm looking at Tag:crossing=marked, and it's a little vague. It says:

Set a node on the highway where the transition is and add highway=crossing + crossing=marked.

If the crossing is also mapped as a way, tag it as highway=footway footway=crossing crossing=marked or highway=cycleway cycleway=crossing crossing=marked as appropriate.

Doesn't that violate the principle of One feature, one OSM element? For example, here's a crossing from where overpass-turbo defaults to showing:

https://www.openstreetmap.org/node/7780814396

https://www.openstreetmap.org/way/833493479

You've got a way with these tags:

crossing=marked
crossing:markings=yes
footway=crossing
highway=footway
surface=asphalt

And the intersection node with the street it's crossing has these tags:

crossing=marked
crossing:markings=yes
highway=crossing
tactile_paving=no

Shouldn't that be one or the other? It makes sense to me to represent the crossing as a way with all the tags, and leave the intersection untagged. I noticed though that StreetComplete doesn't really like that, and will give you quests to add tags to the intersection node even if the way is properly tagged.

13


Just a super quick question about helping to update the map locations.

Between StreetComplete and Organic Maps, which is faster for submitting recommended changes to the OSM team in regards to things like business hours, etc...

14
15


Some really cool transit map generation from OSM data. There's an online demo you can play with here.

16


One shows only a few shops, often the ones that pay the most, the other shows the true number of different places in the area.

17


@osmand why are you so slow? this is a brand new samsung galaxy s24+

@openstreetmap

18


@openstreetmap Is there any documentation on mapping individual small plants like flowers or cacti?
I'd like to start mapping botanical gardens but cannot find any information on this.

19
20
21


Das Atomium in #Brüssel, gerendert in #cgeo auf der 3D #OpenStreetMap #Freizeitkarte sieht lustig aus.

@openstreetmap
@geocaching_de

22
23


cross-posted from: https://discuss.tchncs.de/post/21076796

xkcd #2977: Three Kinds of Research

alt text:

The secret fourth kind is 'we applied a standard theory to their map of every tree and got some suspicious results.'

https://explainxkcd.com/2977/

24


Hi is there some project, instructions or some github repo for converting 360° video and GPX file to something like street view?

I would like to map this way local cycling routes.

25


I have recently got into mapping traffic signs and speed limits where I can, but I realised I don't know what to do when mapping differing speed limit signs that are offset from each other. It's a transition from a 50km/h zone to a 60km/h zone but the signs are offset by 65m, making a sort of "no-mans land" in-between. I plan to map it with the in-between zone tagged with separate maxspeed:forward and maxspeed:backward tags. I assume it should be done this way because as a driver on the ground I would follow the speed limit signs on my side of the road as I passed them, having no knowledge of the reverse sign.

I guess I'm wondering if this is a logical way to map this?

view more: next ›