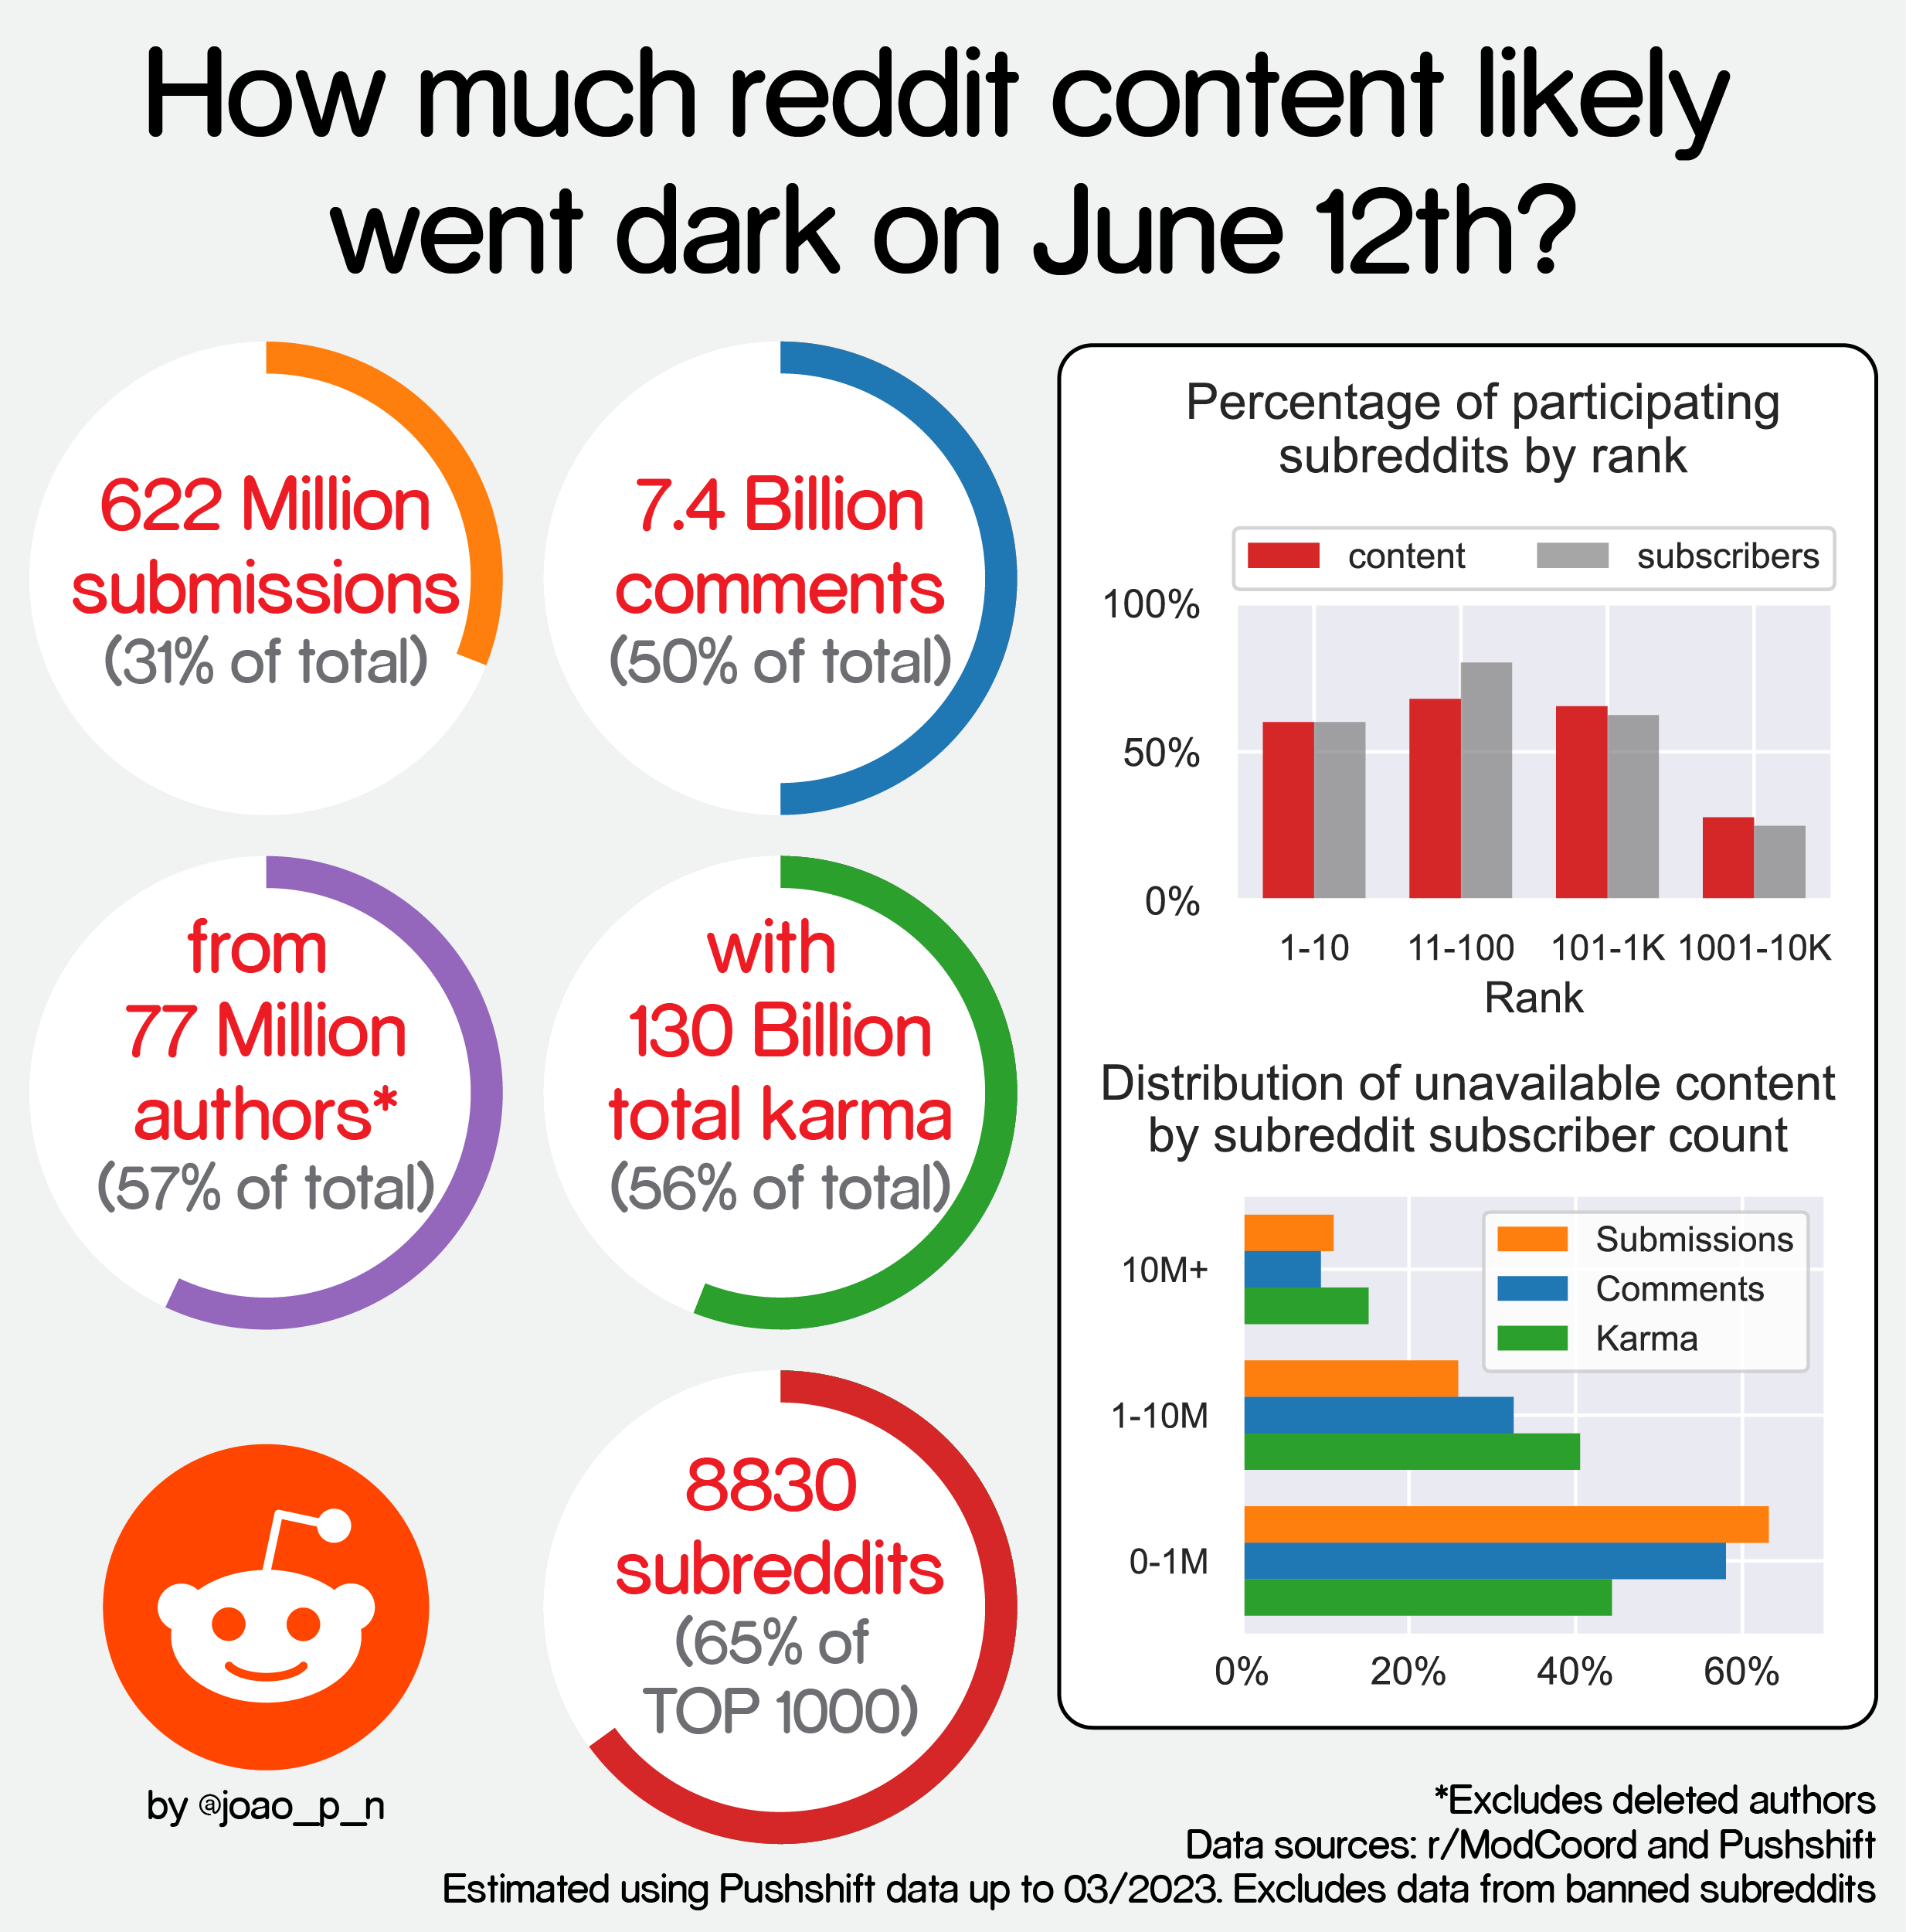
Credit: /u/joaopn on reddit
A place to share and discuss data visualizations. #dataviz
Credit: /u/joaopn on reddit
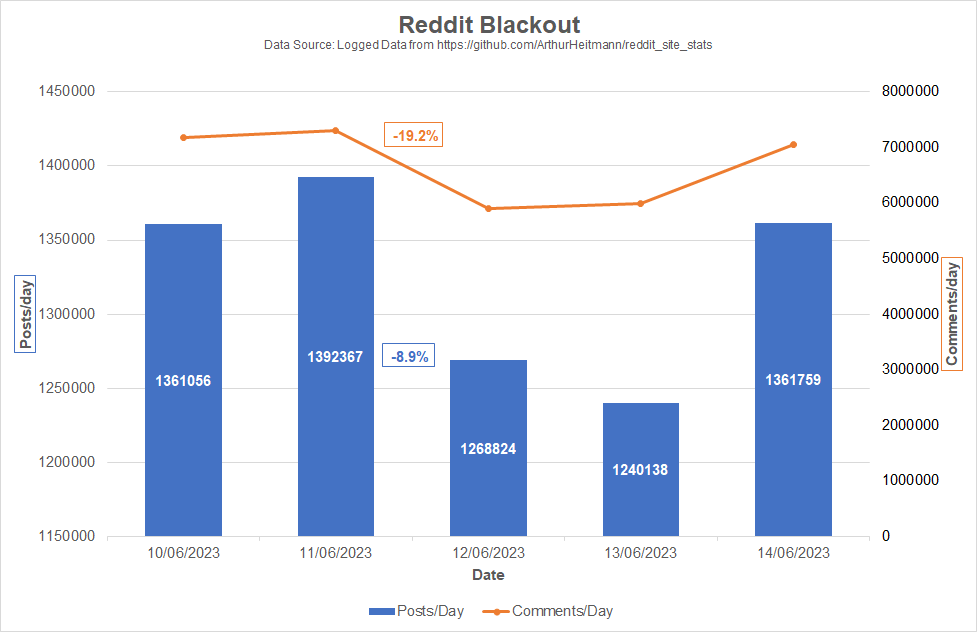
So I took the data from the blackout.photon-reddit site source.
It seems that it makes a Reddit Api call every Minute searching the newest Post and Comment and calculates both per Minute rates.
I wanted to see the effect the Blackout had over the day, so I summed the data and plotted it: Seems like between 11th and 12th June the comments/day diminished by -19.2%. The posts/day saw a decline of -8.9%
The sub with the most Activity was probably Askreddit
And how much is still dark?
HOW MANY MORE POSTS NEED TO DIE
Wow, it's really impactful presented like that
I'm looking forward to lists like this a few weeks after July 1st. I wonder if the migration will result in meaningful effects on Reddit data points.