this post was submitted on 14 Jun 2023
47 points (96.1% liked)
Data Is Beautiful
7156 readers
1 users here now
A place to share and discuss data visualizations. #dataviz
founded 4 years ago
MODERATORS
you are viewing a single comment's thread
view the rest of the comments
view the rest of the comments

So I took the data from the blackout.photon-reddit site source.
It seems that it makes a Reddit Api call every Minute searching the newest Post and Comment and calculates both per Minute rates.
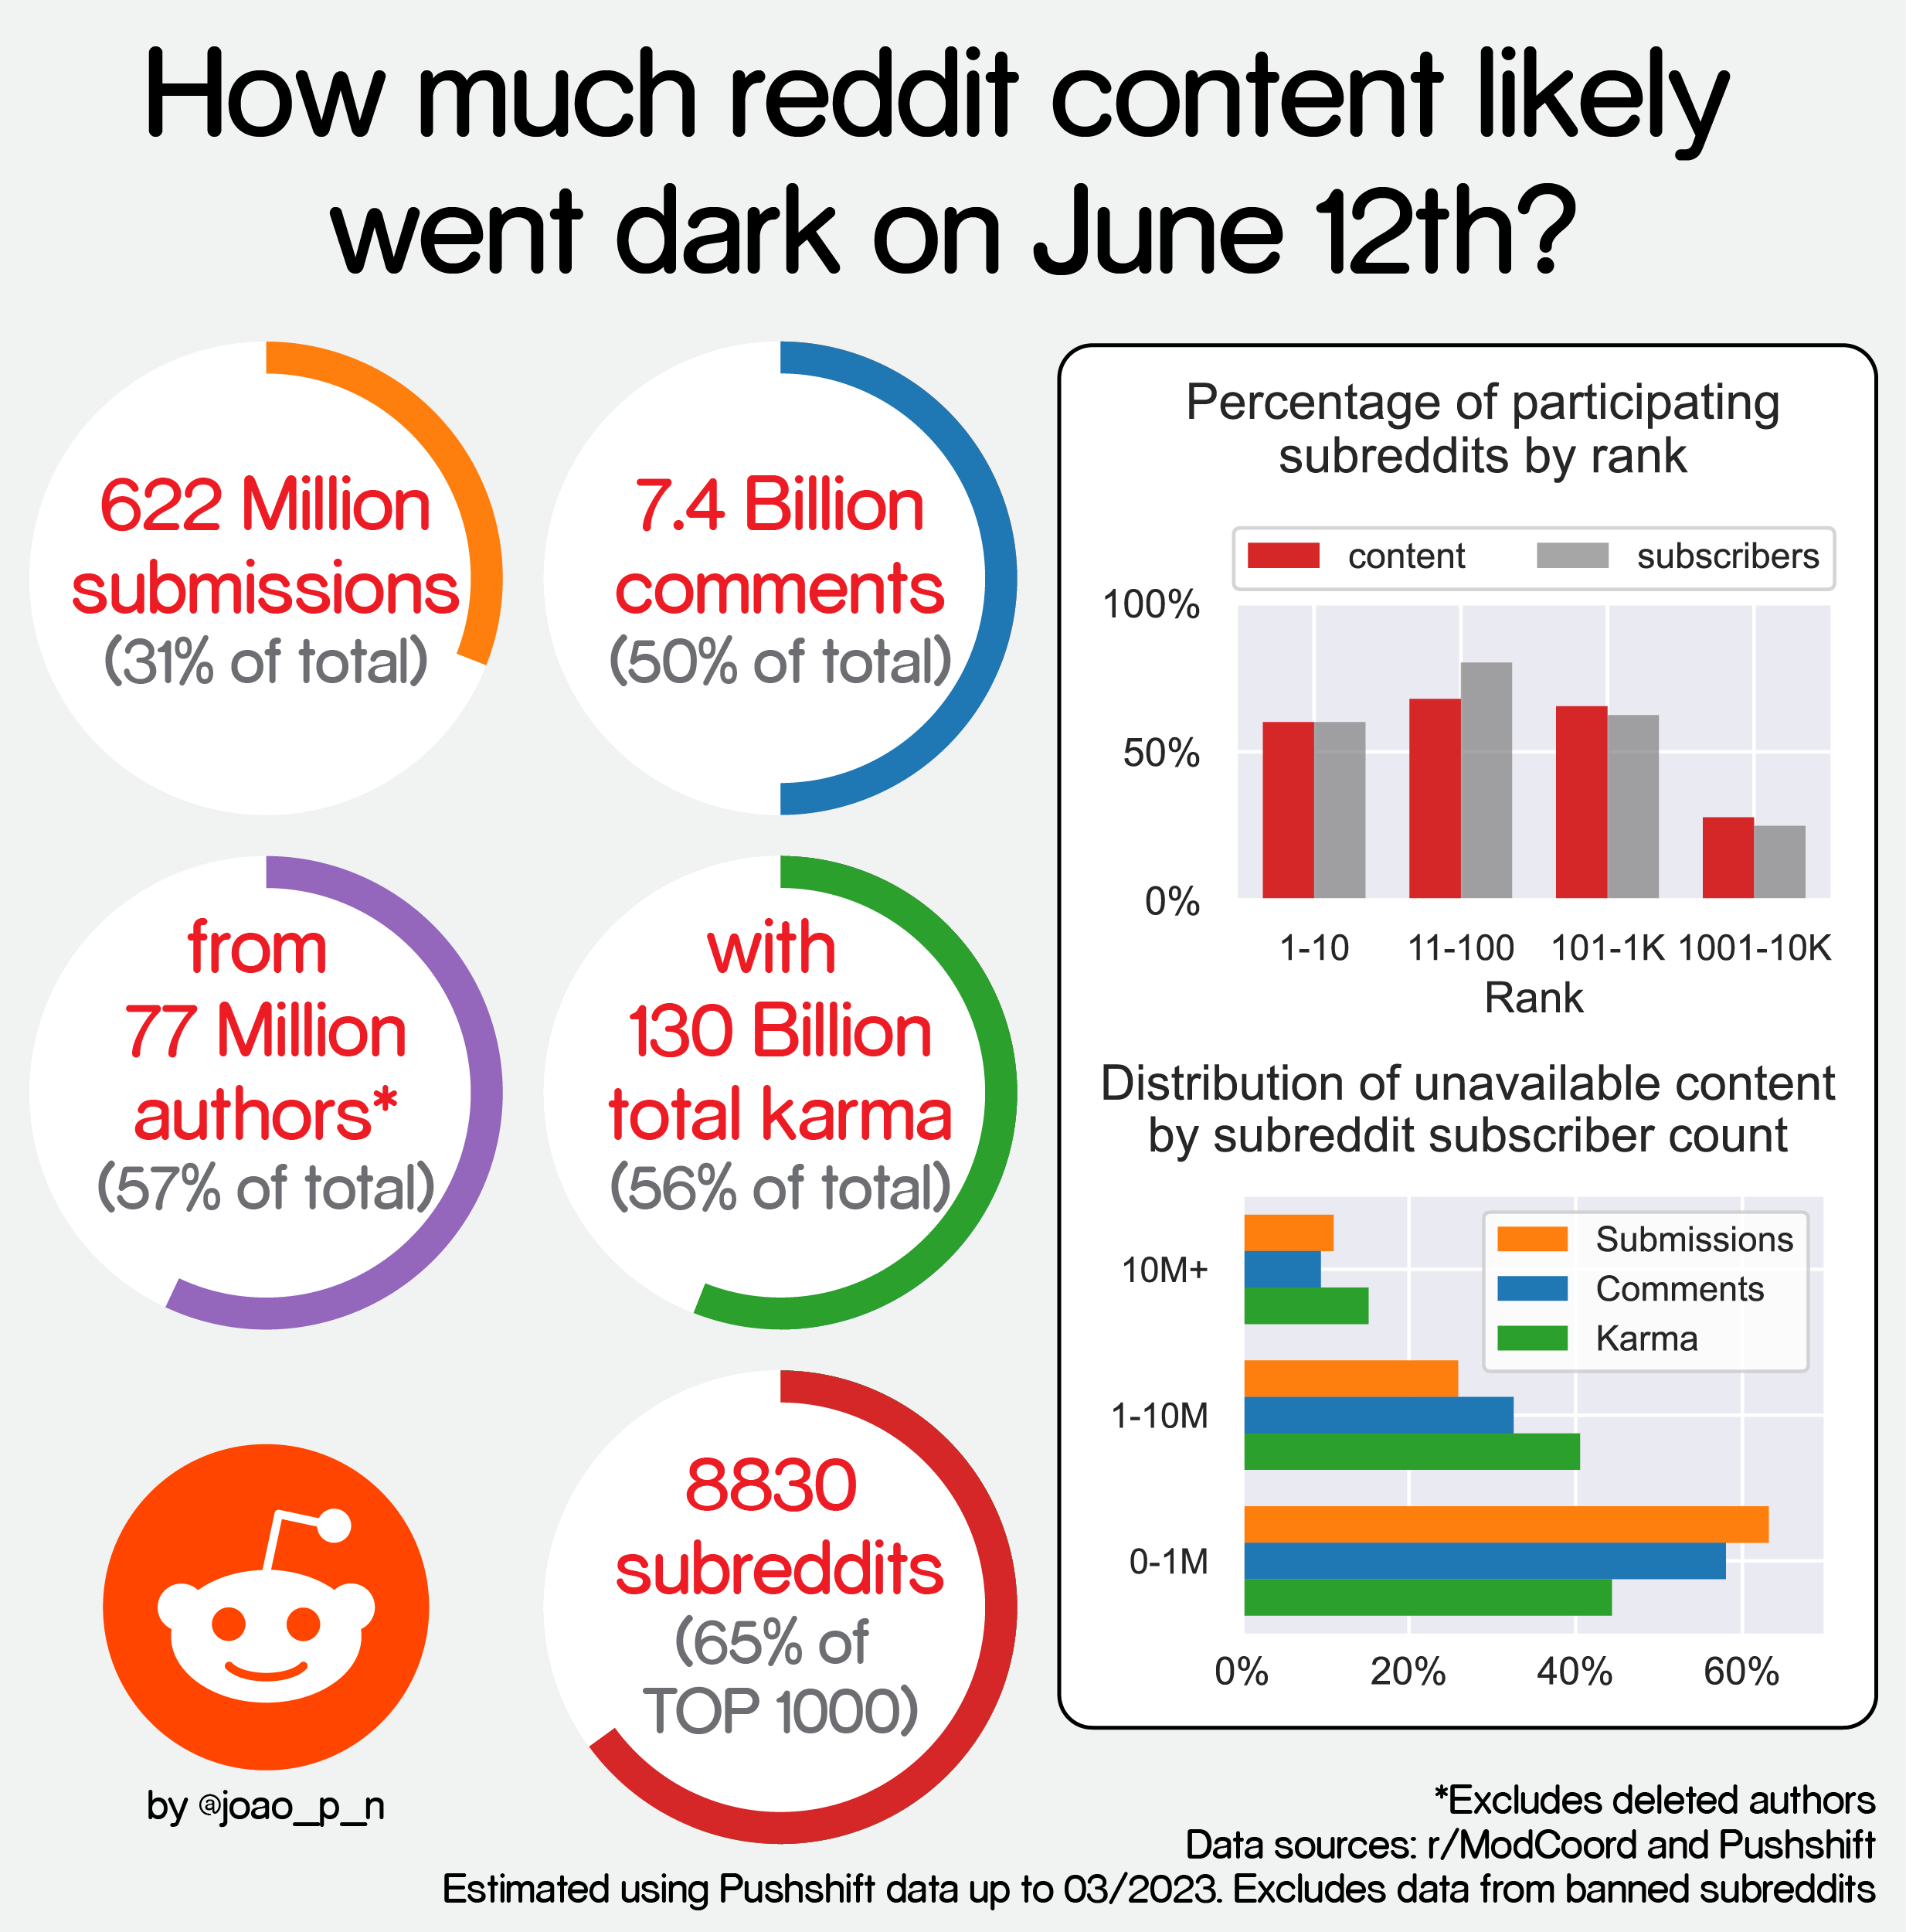
I wanted to see the effect the Blackout had over the day, so I summed the data and plotted it: Seems like between 11th and 12th June the comments/day diminished by -19.2%. The posts/day saw a decline of -8.9%
The sub with the most Activity was probably Askreddit