this post was submitted on 09 Jan 2024
639 points (100.0% liked)
196
16960 readers
1827 users here now
Be sure to follow the rule before you head out.
Rule: You must post before you leave.
If you have any questions, feel free to contact us on our matrix channel.
founded 2 years ago
MODERATORS
you are viewing a single comment's thread
view the rest of the comments
view the rest of the comments

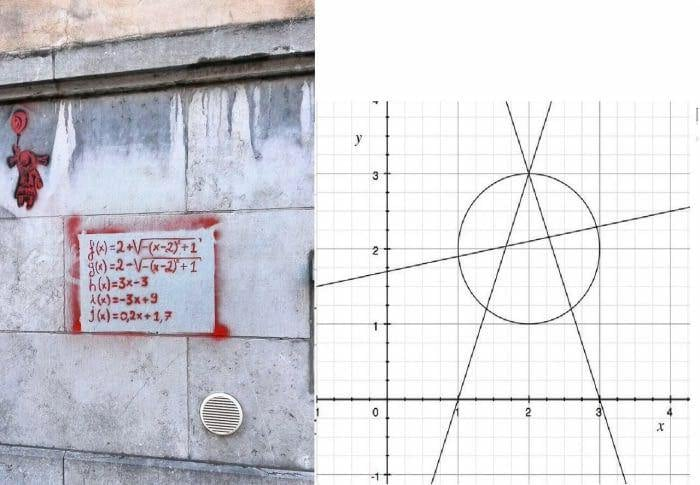
It's the last equation j(x) that's wrong. What's plotted on the right is something like 0.2x+1.6
Your graphing calculator is more than capable of plotting linear functions just as well as desmos.
I wasn't following the image, I was following Desmos's official formula.
The equation works, but since you can't zoom in on TI-83 (or at least I'm not aware you can) you have to scale up the formula to make the symbol appear properly.
i don't mean to be condescending but the TI-83/84 literally has a button labeled ZOOM
Does it really? Man I felt so accomplished when I figured out how to make that formula work. Could've just zoomed in.
Regardless it was a good exercise to mess around with the formulas and see what happens, you're the real winner for having developed a better understanding!
You can zoom on the TI-83/TI-84 by either using the zoom functions or by setting the desired viewport size
Here's a video of someone doing it: https://youtu.be/tEkdCEhSZrY?si=ejhNefLX0qmOUofu
Here is an alternative Piped link(s):
https://piped.video/tEkdCEhSZrY?si=ejhNefLX0qmOUofu
Piped is a privacy-respecting open-source alternative frontend to YouTube.
I'm open-source; check me out at GitHub.