Leftism
Our goal is to be the one stop shop for leftism here at lemmy.world! We welcome anyone with beliefs ranging from SocDemocracy to Anarchism to post, discuss, and interact with our community. We are a democratic community, and as such, welcome metaposts that seek to amend the rules through consensus. Post articles, videos, questions, analysis and more. As long as it's leftist, it's welcome here!
Rules:
- Absolutely no fascism, right wing extremism, genocide denial, etc.
- Unconditional support of authoritarians will not be tolerated
- Good faith discussion about ideologies is encouraged, but no sectarianism
- No brocialism/sexism
- No ableism
- No TERFs/ anti-LGBTQ+ rhetoric
- No racism
- No trolling
- No insults, dunking, or personal attacks
- No posting of misinformation, disinformation, or fake news
- Mods have final say
Posting Expectations:
- Comics/memes/shitposts/propaganda are only allowed on weekends
- Try to avoid liberalism unless discussing electoral politics. Even then, try to focus on tactical agreement towards leftist goals
- Only one meta post seeking consensus per person per day
- Posts about a particular ideology are ok, but remember the rules above
- Remember that there is no “right way” to implement leftist theory. This rule does not prevent academic criticism.
- Try to avoid extremely sensitive topics unless approaching them with appropriate care for intersectionality. Use your best judgement, and be prepared to provide respectable sources when having these discussions. Wikipedia is not an acceptable source in these cases.
- Post titles must be meaningful and relevant, except on weekends
Sister Communities:
[email protected] [email protected] [email protected] [email protected] [email protected] [email protected] [email protected] [email protected] [email protected] [email protected] [email protected] [email protected] Solarpunk memes [email protected] [email protected] [email protected] [email protected] [email protected]
view the rest of the comments

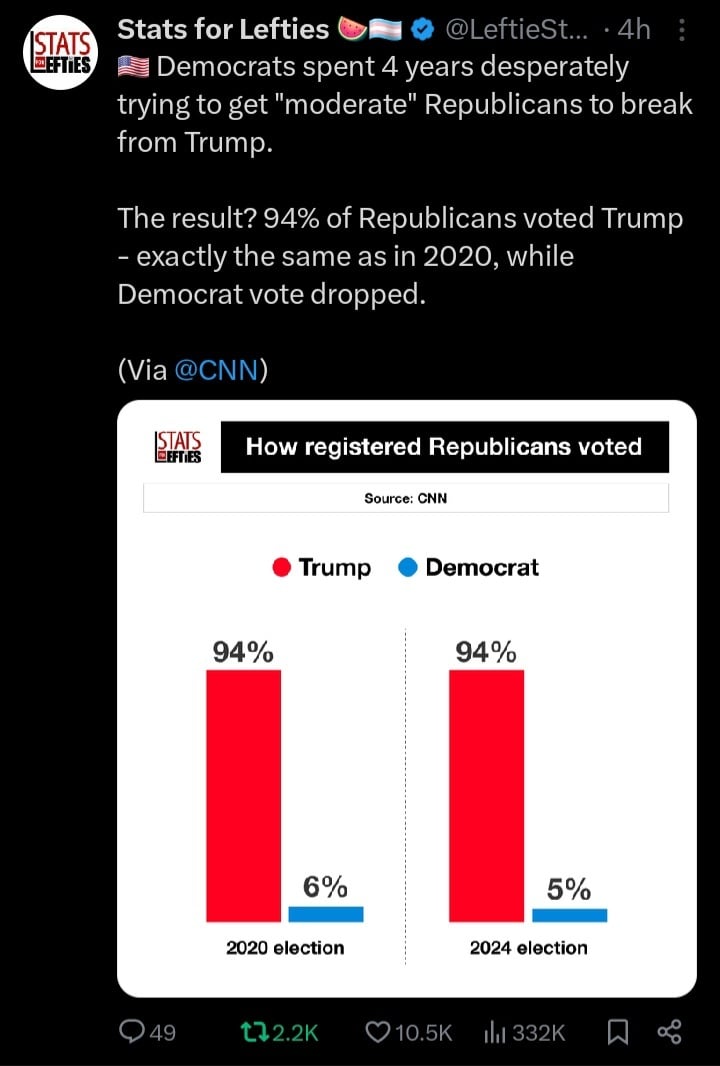
And how did the absolute number of them changed? The chart is meaningless without that - as far as we know the pleading worked, all the moderate Republicans left and are no longer registered Republicans. The percentage of Democrat votes among Republicans got smaller because they not only voted Democrat, they also changes their party registration.
I don't think it happened, I'm just saying these percentages alone aren't proving anything either way.
I agree, the chart is meaningless. Votes are anonymous, they don't have your name on them or anything. So the only way they can get this info is by people self reporting it, or something seriously fraudulent happening.
IMO, the chart amounts to "we asked registered Republicans to tell us who they voted for and 94% of respondents said they voted Republican" ..... And?
The information is without merit or value.
I see your point, and that's fair too. But what I'm saying is that even if the data was 100% reliable, the chart still can't be used without the absolute numbers shown.
I absolutely agree with that. Either the total number of respondents or the absolute number of voters on each side.
It's still self reported information which can very easily misrepresent what actually happened, but at least there would be some weight to the figures in any way, shape, or form.