this post was submitted on 24 Jun 2024
33 points (97.1% liked)

Lemmy Support

4622 readers
15 users here now

Support / questions about Lemmy.

Matrix Space: #lemmy-space

founded 5 years ago
MODERATORS
 

EDIT: It seems to have been fixed thanks to @[email protected]. Running analyze verbose; in postgres.

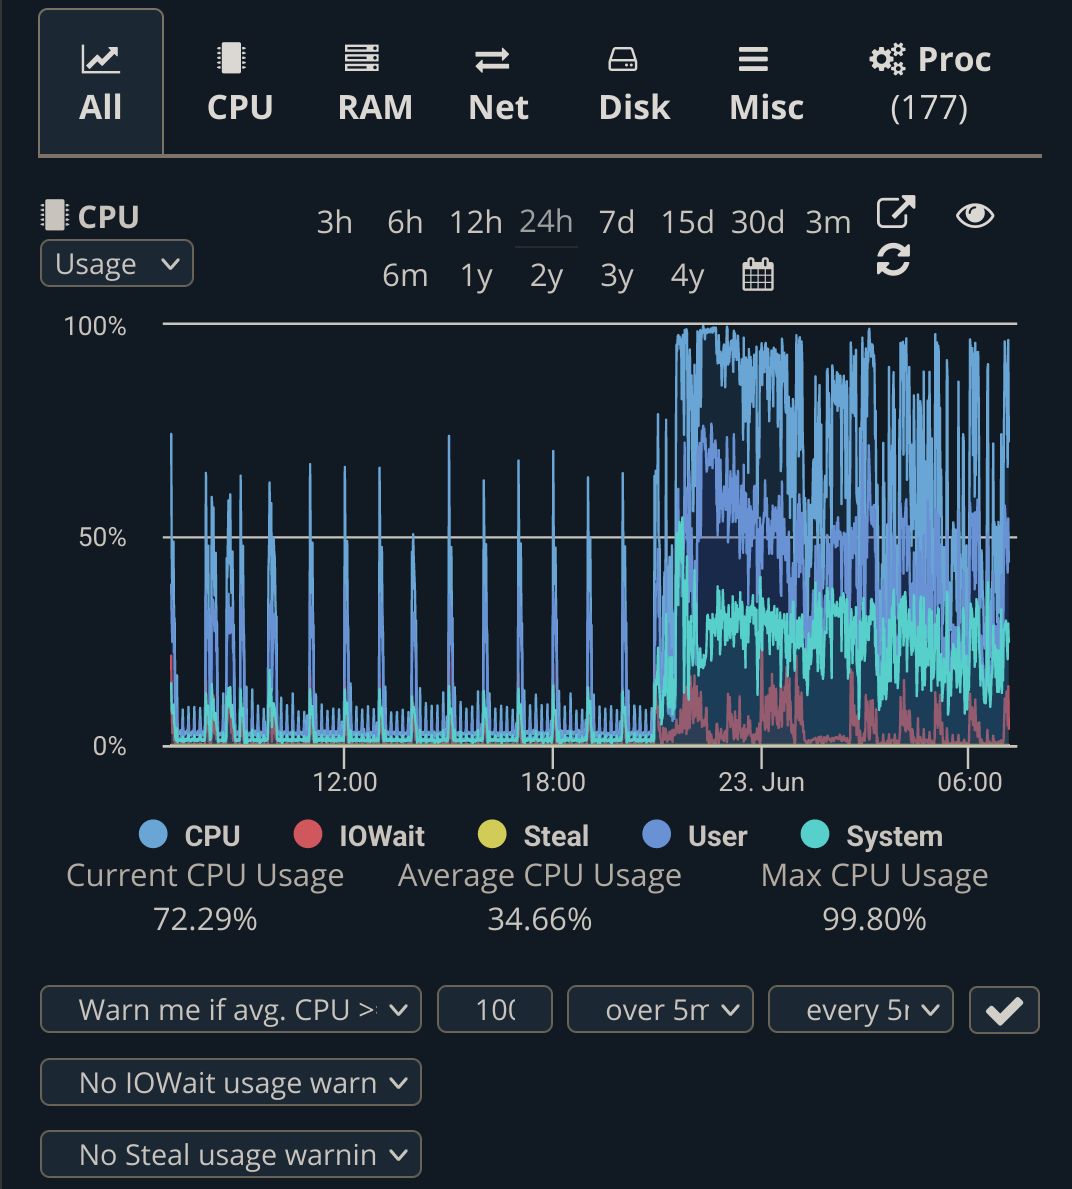
After updating to 0.19.5 from 0.19.3 my postgres is often using up 500%+ of CPU according to docker stats and often going to 100% CPU on most cores according to htop. Also noticed in the uptime monitor:

htop shows one of the 5 postgres processes constantly on UPDATE. I think this might be part of the problem.

I'm not comfortable with postgres and am honestly completely in the dark how or where to mitigate or even pinpoint this issue.

Any help would be appreciated.

all 21 comments
sorted by: hot top controversial new old
[–] [email protected] 7 points 1 month ago (2 children)

Did you update postgres as well? 0.19.4 needs a newer version.

[–] [email protected] 3 points 1 month ago (1 children)

I have. It's running postgres v16.3

[–] [email protected] 9 points 1 month ago (1 children)

Sometimes after upgrades, even minor ones, I find it useful to run analyze on all of the tables. I usually do analyze verbose; so I can see which tables are getting analyzed. This will assess every table so the query planner can make better decisions about how to resolve queries. If the query planner is making bad decisions I/O and CPU will be high and query performance will be poor.

[–] [email protected] 4 points 1 month ago* (last edited 1 month ago)

Thanks. I ran it. Hopefully it'll make a difference.

Edit: It looks like this did the trick. I'll keep monitoring to see if it sticks. Thanks again!

[–] [email protected] 4 points 1 month ago (1 children)

You can use pg_stat_statements to find slow queries. Try sorting by top total_exec_time.

[–] [email protected] 2 points 1 month ago (1 children)
ERROR:  extension "pg_stats_statements" is not available

Even though it's added in the customPostgresql.conf shared_preload_libraries = 'auto_explain,pg_stat_statements'

[–] [email protected] 4 points 1 month ago (1 children)

I know you already found a solution, but fwiw, it seems you have a typo in calling the extension. You have "stats" plural instead of "stat" singular.

[–] [email protected] 2 points 1 month ago

Well that would do it. Thanks for pointing out!

[–] [email protected] 4 points 1 month ago (1 children)

Oh man, i just remembered cve-2024-3094 lol

[–] [email protected] 3 points 1 month ago

commit "fixed stuff"

2.8k blob of crypto mining code

Would be hilarious

[–] [email protected] 2 points 1 month ago (1 children)

Do you have any tweaks of pg settings? Eg. shm mem, shared_buffers etc. ?

If not you migh want to: https://pgtune.leopard.in.ua/

[–] [email protected] 2 points 1 month ago (1 children)

I have. And I tried to tweak it with no avail. But it was working within acceptable levels before the update.

[–] [email protected] 2 points 1 month ago* (last edited 1 month ago) (1 children)

hmm, how many connections are used SELECT count(*) FROM pg_stat_activity; ?
I am not a master postgres admin but my intuition has been that the amount of connections is a big factor in how pg behaves with cpu and mem.

[–] [email protected] 1 points 1 month ago (1 children)
ERROR:  extension "pg_stats_statements" is not available

Even though it's added in the customPostgresql.conf shared_preload_libraries = 'auto_explain,pg_stat_statements'

[–] [email protected] 2 points 1 month ago (1 children)

extension "pg_stats_statements" is not available

According to this https://stackoverflow.com/a/72966651/5881796

The extension is not loaded: CREATE EXTENSION pg_stat_statements;

[–] [email protected] 2 points 1 month ago (1 children)

I added pg_stat_statements, and ran it. This was the result:

# SELECT count(*) FROM pg_stat_activity;
 count
-------
    11
(1 row)

[–] [email protected] 3 points 1 month ago (1 children)

do you also have pict-rs connected to this postgres instance? that is surprisingly low number to me, I would have expected anywhere between 20-50 active connections (I use 50 for lemmy and 20 for pict-rs, configured in their respective conf files)

[–] [email protected] 2 points 1 month ago (1 children)

I think so. I have lemmy and everything needed running through a single docker container using Lemmy-Easy-Deploy.

[–] [email protected] 1 points 1 month ago* (last edited 1 month ago) (1 children)

Ah, you are using pretty different deployment then, even the used postgres image is different then the usual deployment ( pgautoupgrade/pgautoupgrade:16-alpine instead of postgres:16-alpine) this might or might not cause differences.

I would try increasing POSTGRES_POOL_SIZE to 10-20, but I am guessing here, the idea being that lemmy is hammering postgres through the default 5 conns which increases CPU but that is a bit of stretch

[–] [email protected] 2 points 1 month ago

It thankfully seems to have been fixed thanks to @[email protected]. Running analyze verbose; in postgres.

The pgautoupgrade was added for the new version because this deployment is an all-in-one solution for running lemmy. And upgrading the databases turned out to be quite the effort until some user pointed the maintainer towards pgautoupgrade here.

I tried running lemmy before I found out about this, but this just makes it so much more convenient to run.